Color Mode
U.S. States Ranked by Average IQ - High-Resolution Infographics
Published on October 14, 2025
The cognitive abilities and average intelligence of people across the United States are not uniform-they vary widely from state to state. These differences are influenced by a mix of educational opportunities, economic conditions, and access to learning resources like libraries, schools, and enrichment programs. In other words, where you live can have a noticeable impact on the average IQ in your state.
Using the most up-to-date 2025 data, this article ranks all 50 states by their average IQ, giving a clear picture of which regions are leading and which lag behind. But numbers alone don’t tell the full story. That’s why we’ve paired the data with 13 high-resolution, easy-to-read infographics that highlight patterns, comparisons, and trends in a visual, intuitive way.
Explore the Map: IQ Across the U.S.
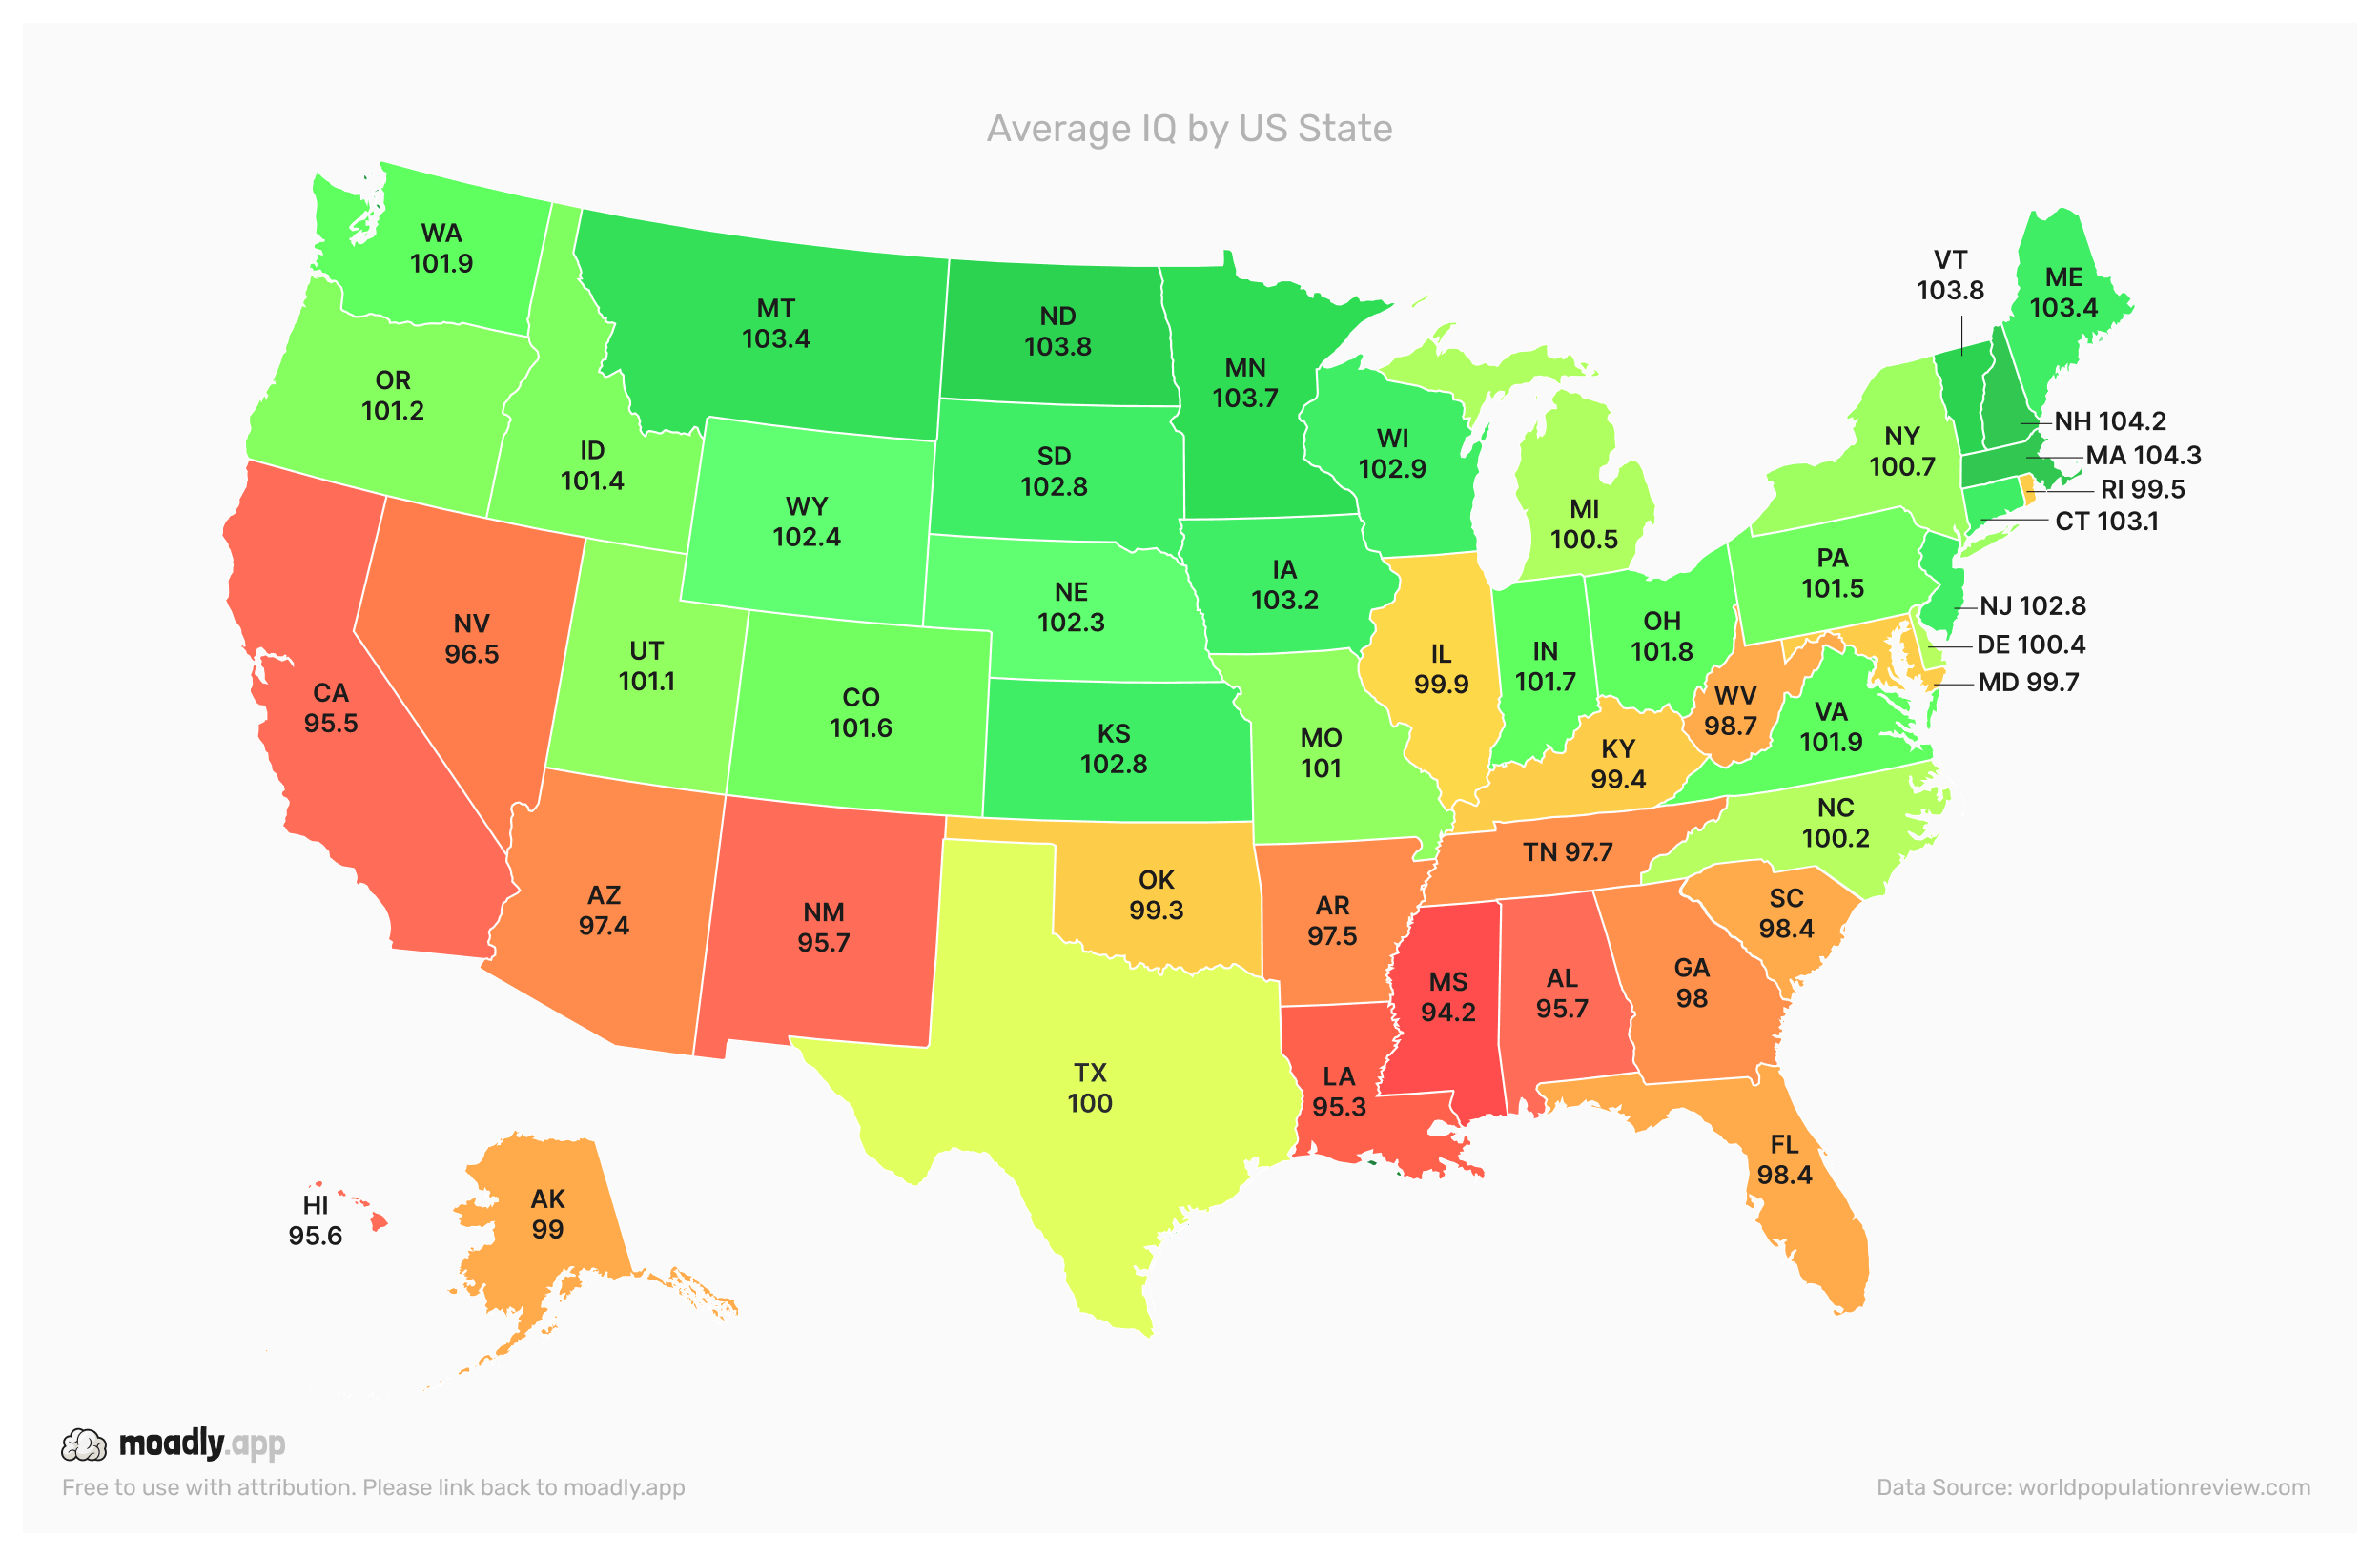
The main infographic above is your first stop. It’s more than just a map-it’s a snapshot of how intelligence is distributed across the country. Darker shades indicate higher average IQs, and you’ll immediately notice some clear trends:
- The Northeast: A cluster of states stands out with the highest averages, showing a concentration of educational resources and strong school systems.
- The Midwest: Surprisingly consistent, these states maintain IQs above the national average, reflecting balanced access to education and community support.
- The South & West: While some states perform well, many show slightly lower averages, highlighting the impact of economic and social disparities.
As you scroll through the article, each infographic will break down these trends further, making it easy to compare states, regions, and even individual state pairings. You’ll not only see who ranks where but also understand why these differences exist and what factors may be contributing to them.
State-by-State Average IQ Table
| State | Average IQ |
|---|---|
| Massachusetts | 104.3 |
| New Hampshire | 104.2 |
| North Dakota | 103.8 |
| Vermont | 103.8 |
| Minnesota | 103.7 |
| Maine | 103.4 |
| Montana | 103.4 |
| Iowa | 103.2 |
| Connecticut | 103.1 |
| Wisconsin | 102.9 |
| Kansas | 102.8 |
| New Jersey | 102.8 |
| South Dakota | 102.8 |
| Wyoming | 102.4 |
| Nebraska | 102.3 |
| Virginia | 101.9 |
| Washington | 101.9 |
| Ohio | 101.8 |
| Indiana | 101.7 |
| Colorado | 101.6 |
| Pennsylvania | 101.5 |
| Idaho | 101.4 |
| Oregon | 101.2 |
| Utah | 101.1 |
| Missouri | 101.0 |
| New York | 100.7 |
| Michigan | 100.5 |
| Delaware | 100.4 |
| North Carolina | 100.2 |
| Texas | 100.0 |
| Illinois | 99.9 |
| Maryland | 99.7 |
| Rhode Island | 99.5 |
| Kentucky | 99.4 |
| Oklahoma | 99.3 |
| Alaska | 99.0 |
| West Virginia | 98.7 |
| Florida | 98.4 |
| South Carolina | 98.4 |
| Georgia | 98.0 |
| Tennessee | 97.7 |
| Arkansas | 97.5 |
| Arizona | 97.4 |
| Nevada | 96.5 |
| Alabama | 95.7 |
| New Mexico | 95.7 |
| Hawaii | 95.6 |
| California | 95.5 |
| Louisiana | 95.3 |
| Mississippi | 94.2 |
| United States (average) | 100.3 |
Analysis of High-Resolution Infographics
1. Highest IQ U.S. States
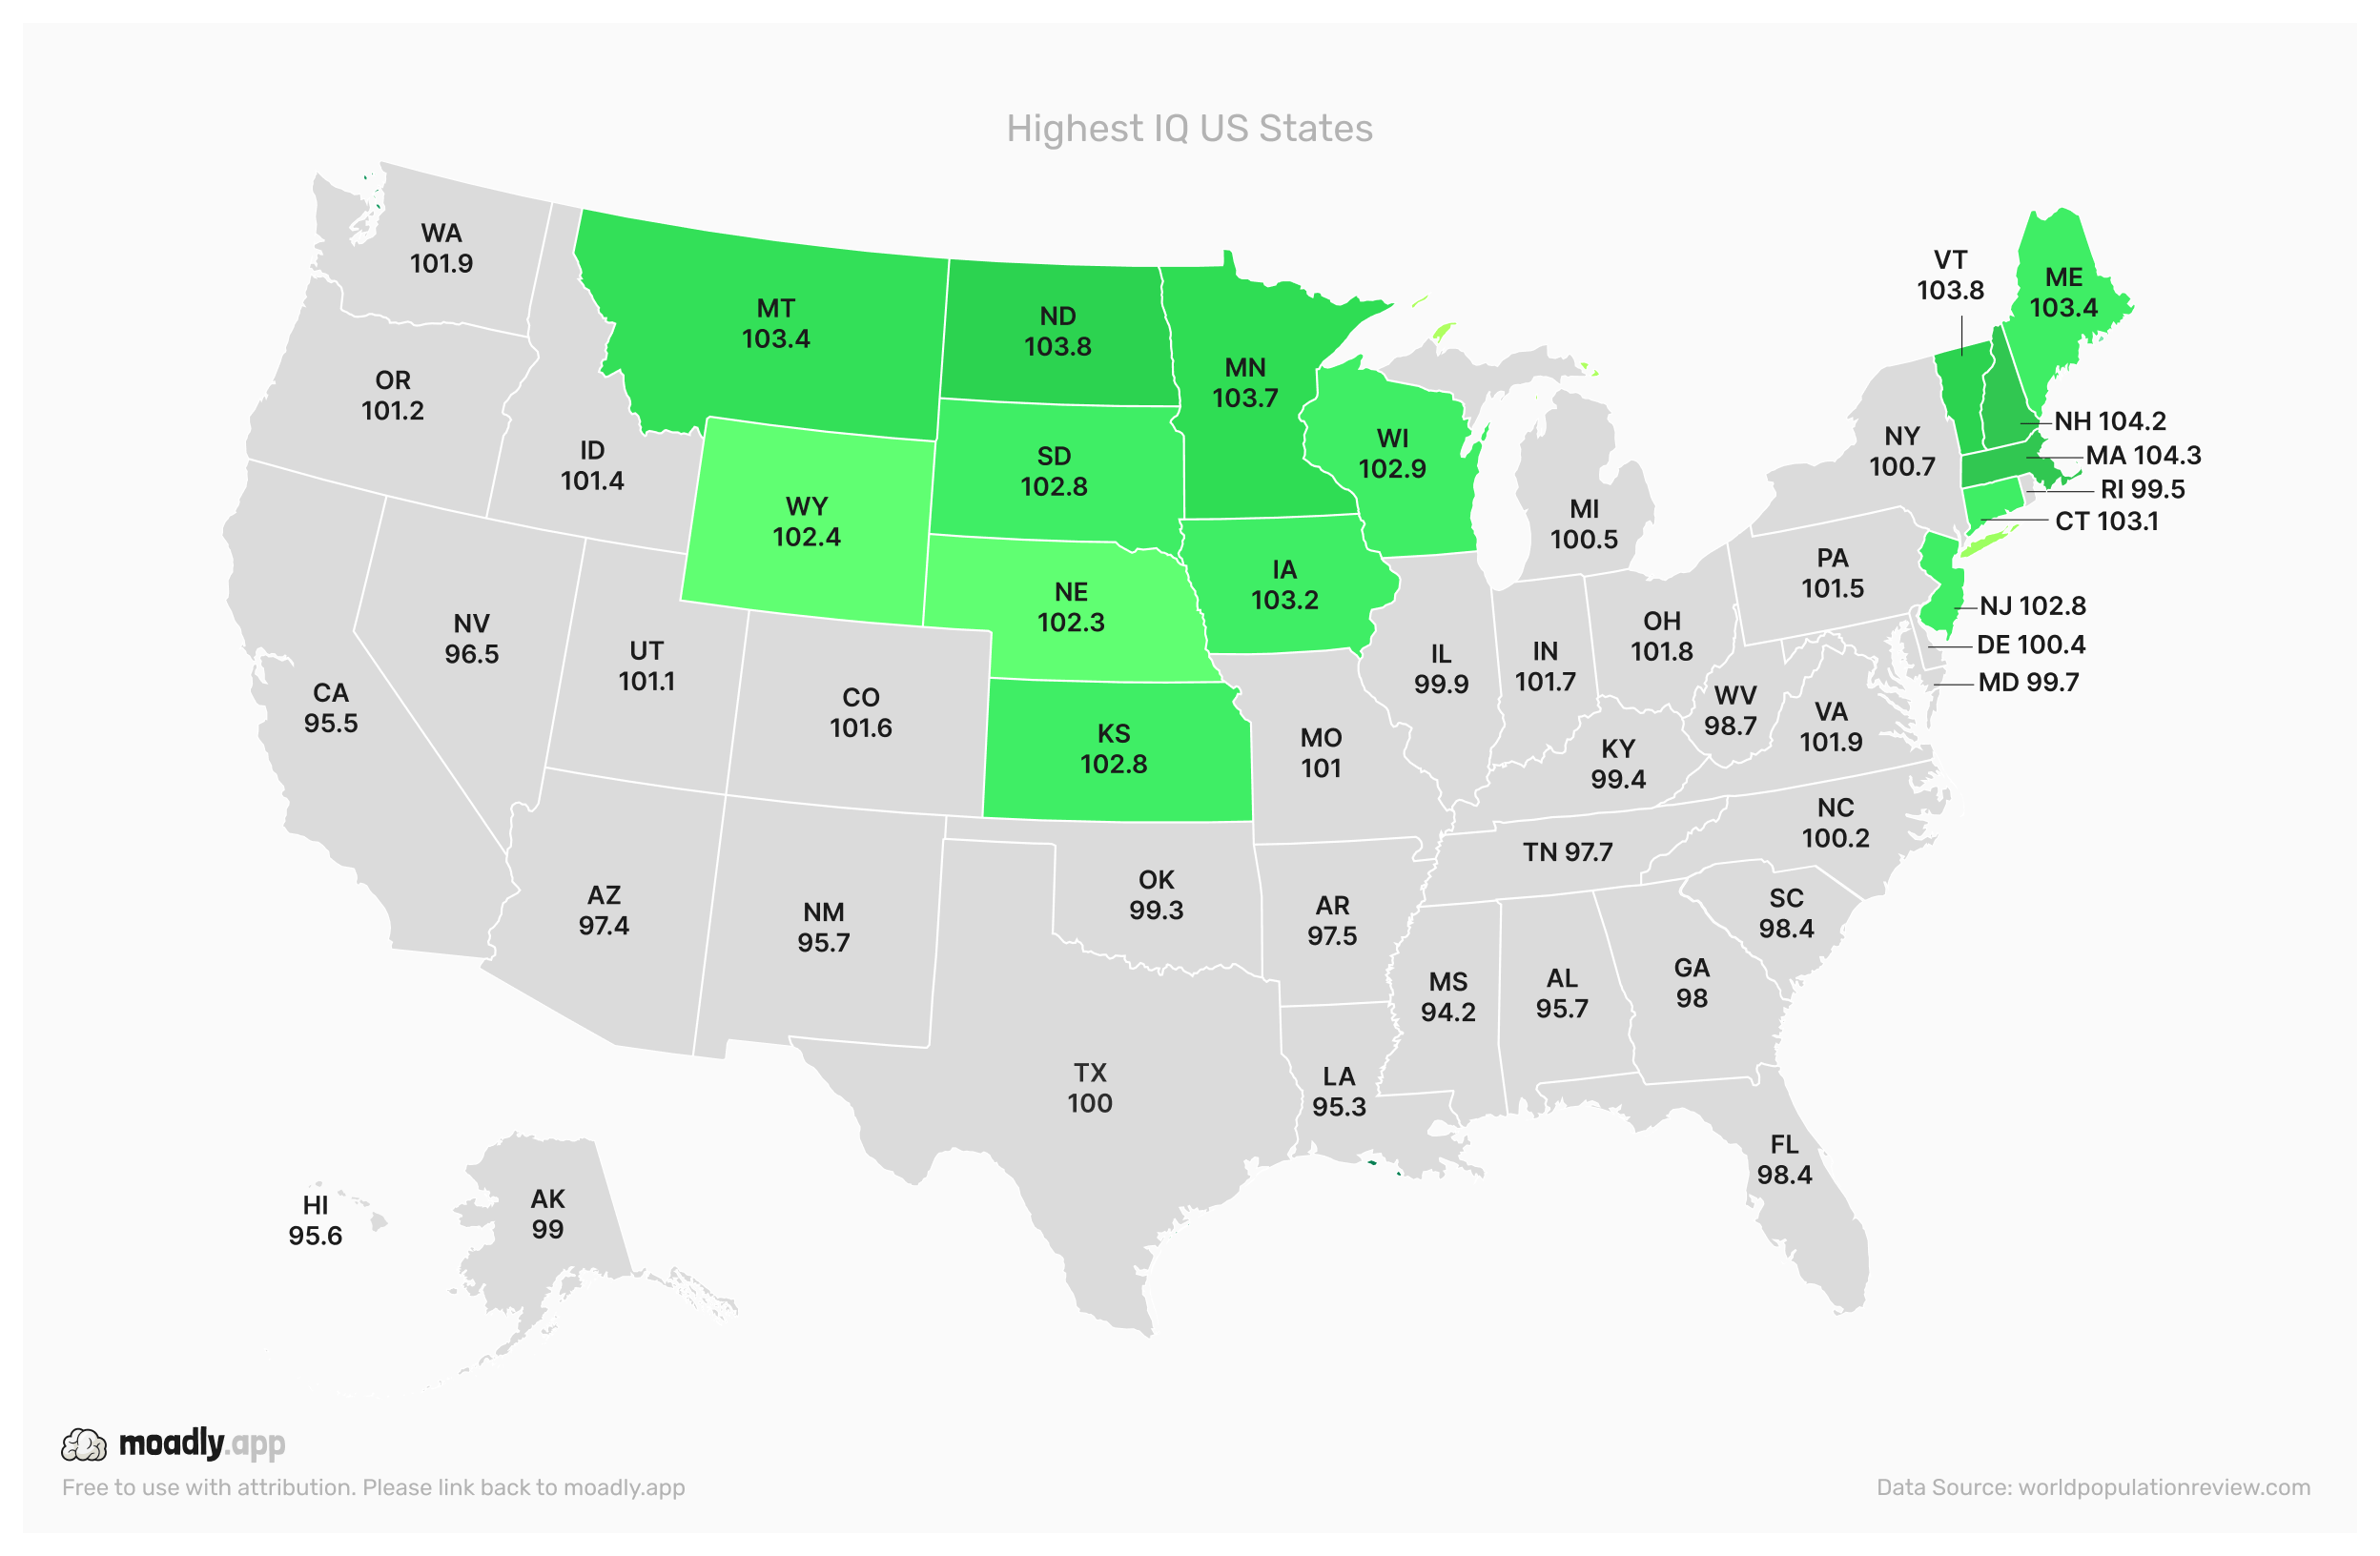
This chart provides a clear visual snapshot of the top-performing U.S. states by average IQ. It makes it easy to see which regions consistently lead in cognitive performance and how they compare to one another.
Massachusetts, New Hampshire, and North Dakota consistently rank at the top. These states benefit from a combination of factors that support intellectual development, including world-class schooling systems and strong emphasis on early childhood education.
Investment in STEM fields is another key contributor. Schools and universities in these states focus heavily on science, technology, engineering, and mathematics, fostering analytical thinking and problem-solving skills from an early age.
Beyond formal education, community programs, public libraries, and enrichment opportunities play an important role. These resources create environments where both children and adults can continually exercise their cognitive abilities.
The chart also allows for easy comparison with neighboring states, providing a broader perspective on how regional policies, culture, and access to resources influence average IQ. By studying these top-performing states, policymakers and educators can identify strategies to improve educational outcomes nationwide.
2. Lowest IQ U.S. States
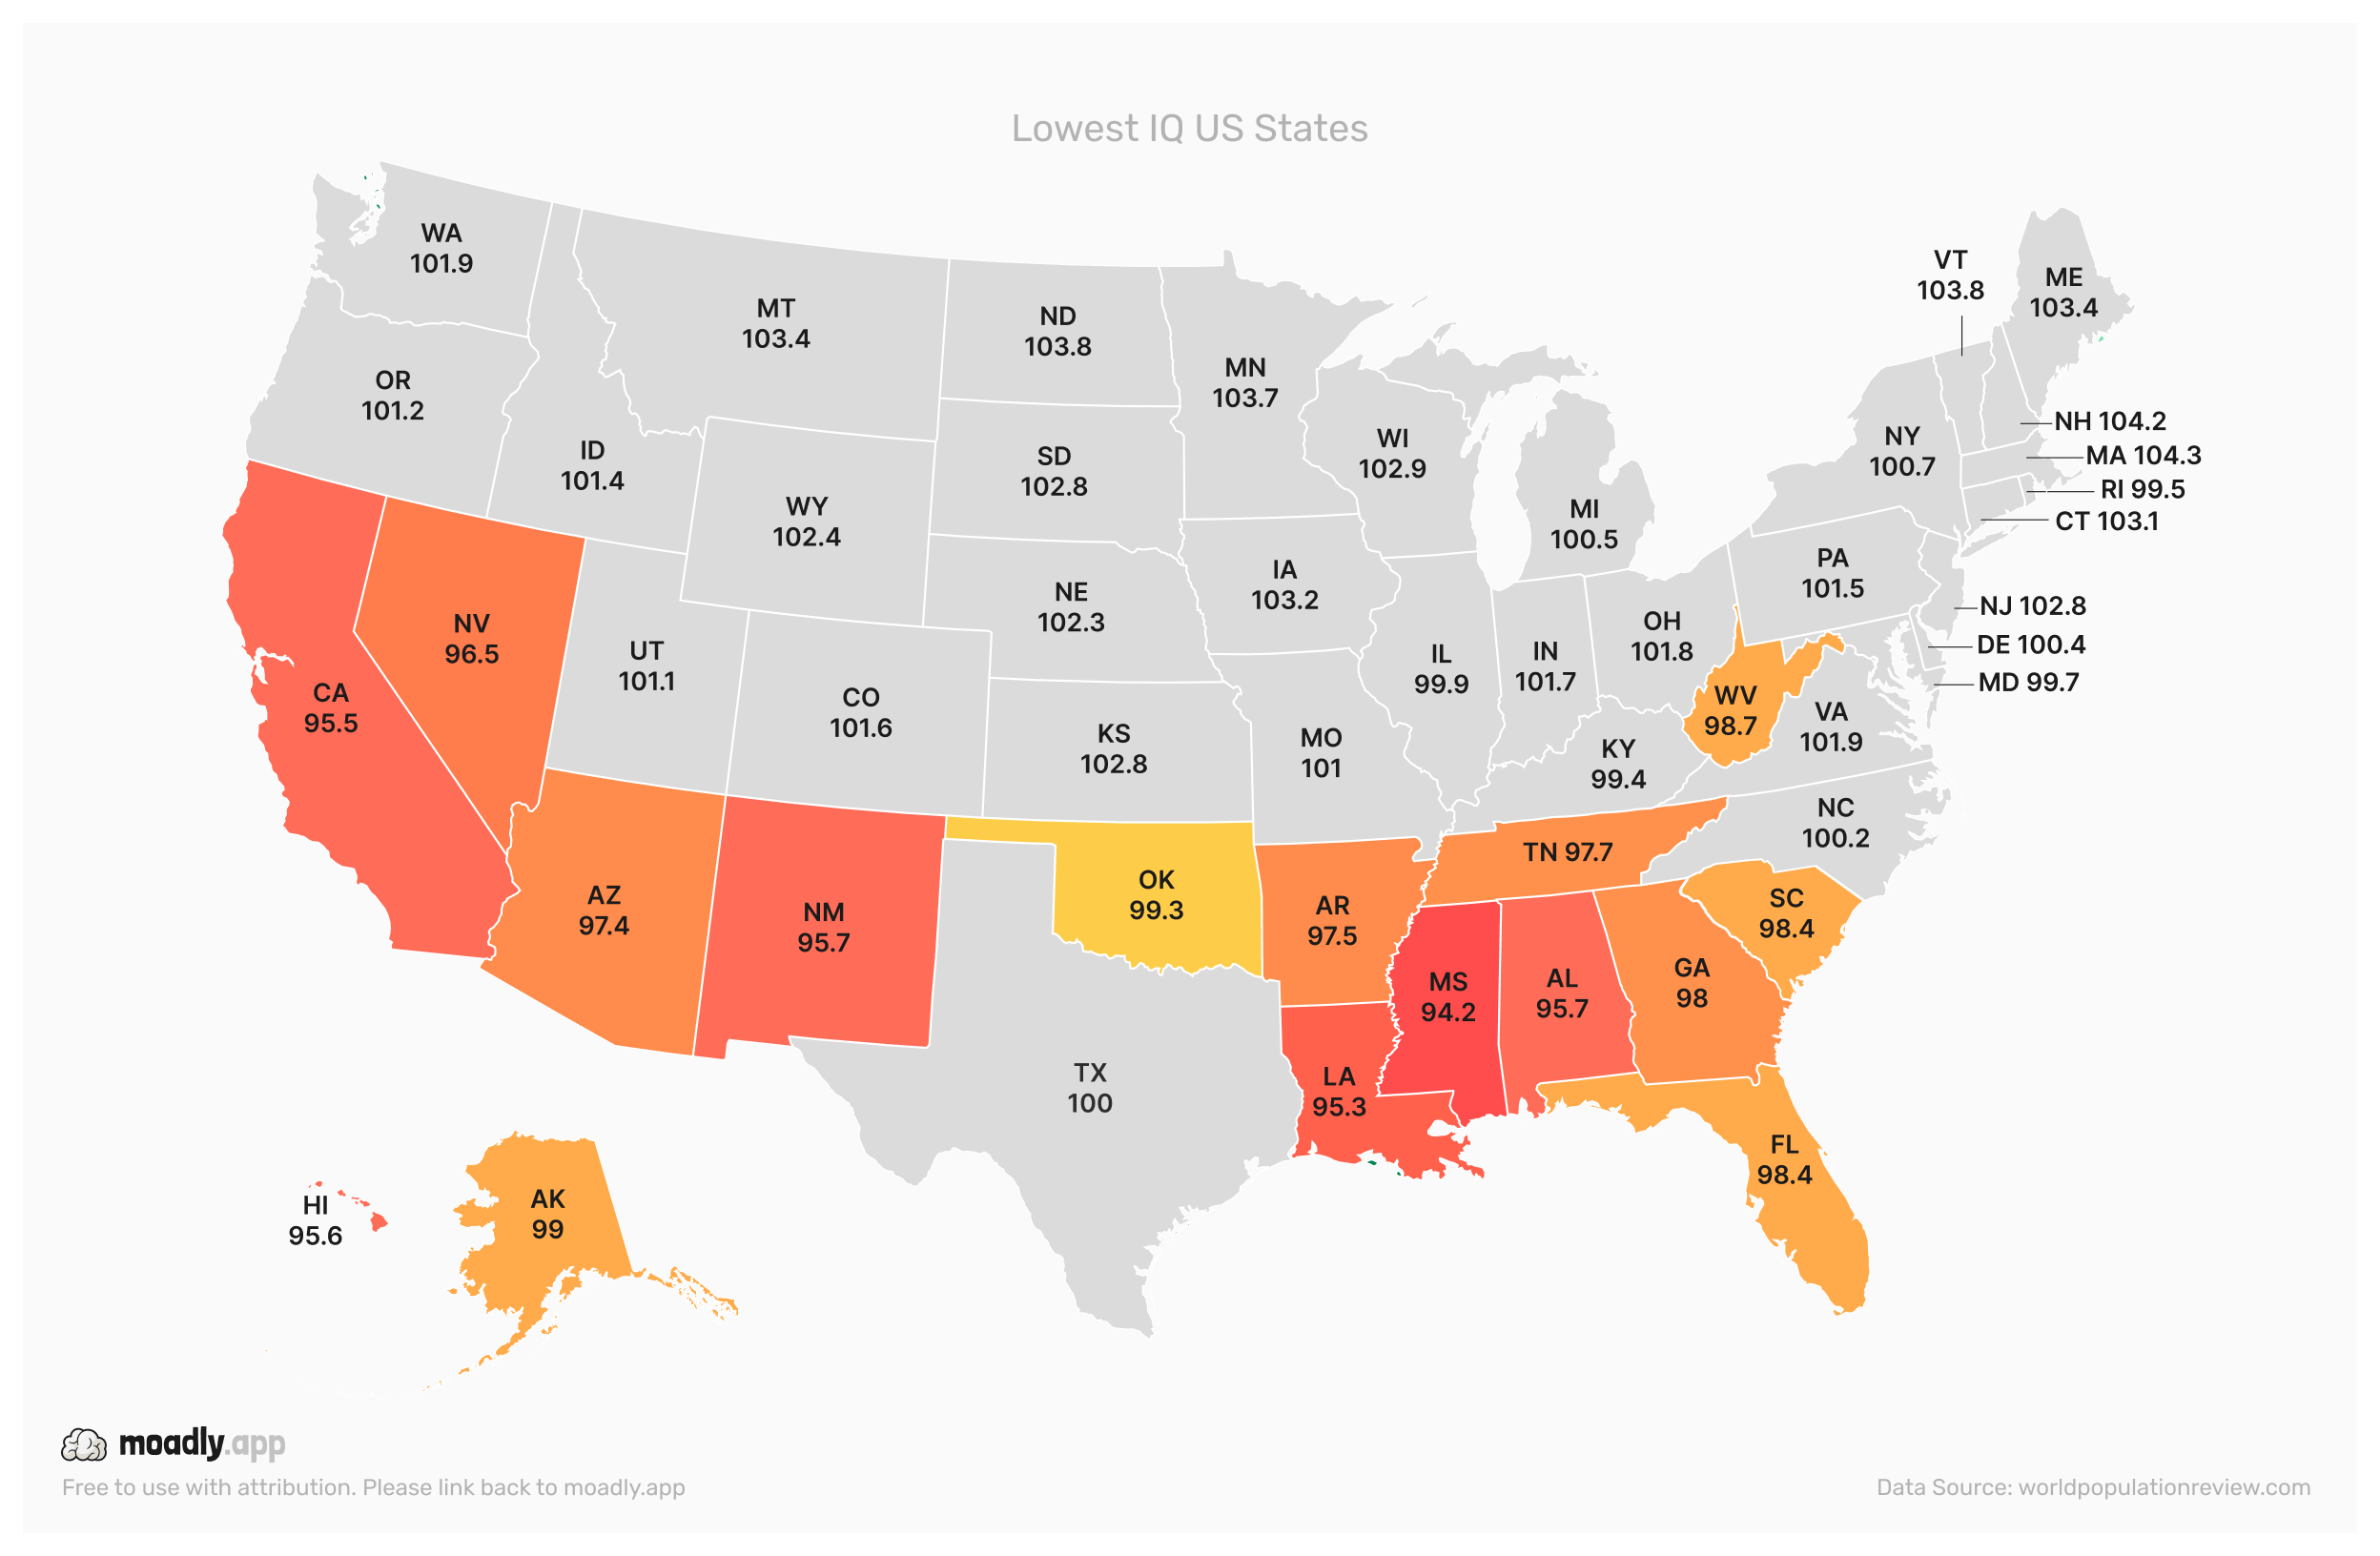
On the other end of the spectrum, states like Mississippi, Louisiana, and California tend to rank lower in average IQ. This chart highlights the states where cognitive performance falls below the national mean.
Several factors contribute to these results. Historical inequalities, economic challenges, and social disparities play a significant role in shaping educational outcomes and overall intellectual development. In many cases, communities in these states face limited access to high-quality schooling and enrichment programs.
Access to resources such as well-funded schools, libraries, and extracurricular programs is uneven, which can affect the development of critical thinking, problem-solving, and other cognitive skills over time. Population diversity, urban-rural divides, and migration patterns also influence state averages.
By examining these lower-performing states, policymakers and educators can better understand where targeted investments in education, early childhood programs, and community support can help bridge gaps and improve outcomes for future generations.
3. Top 10 U.S. States by IQ
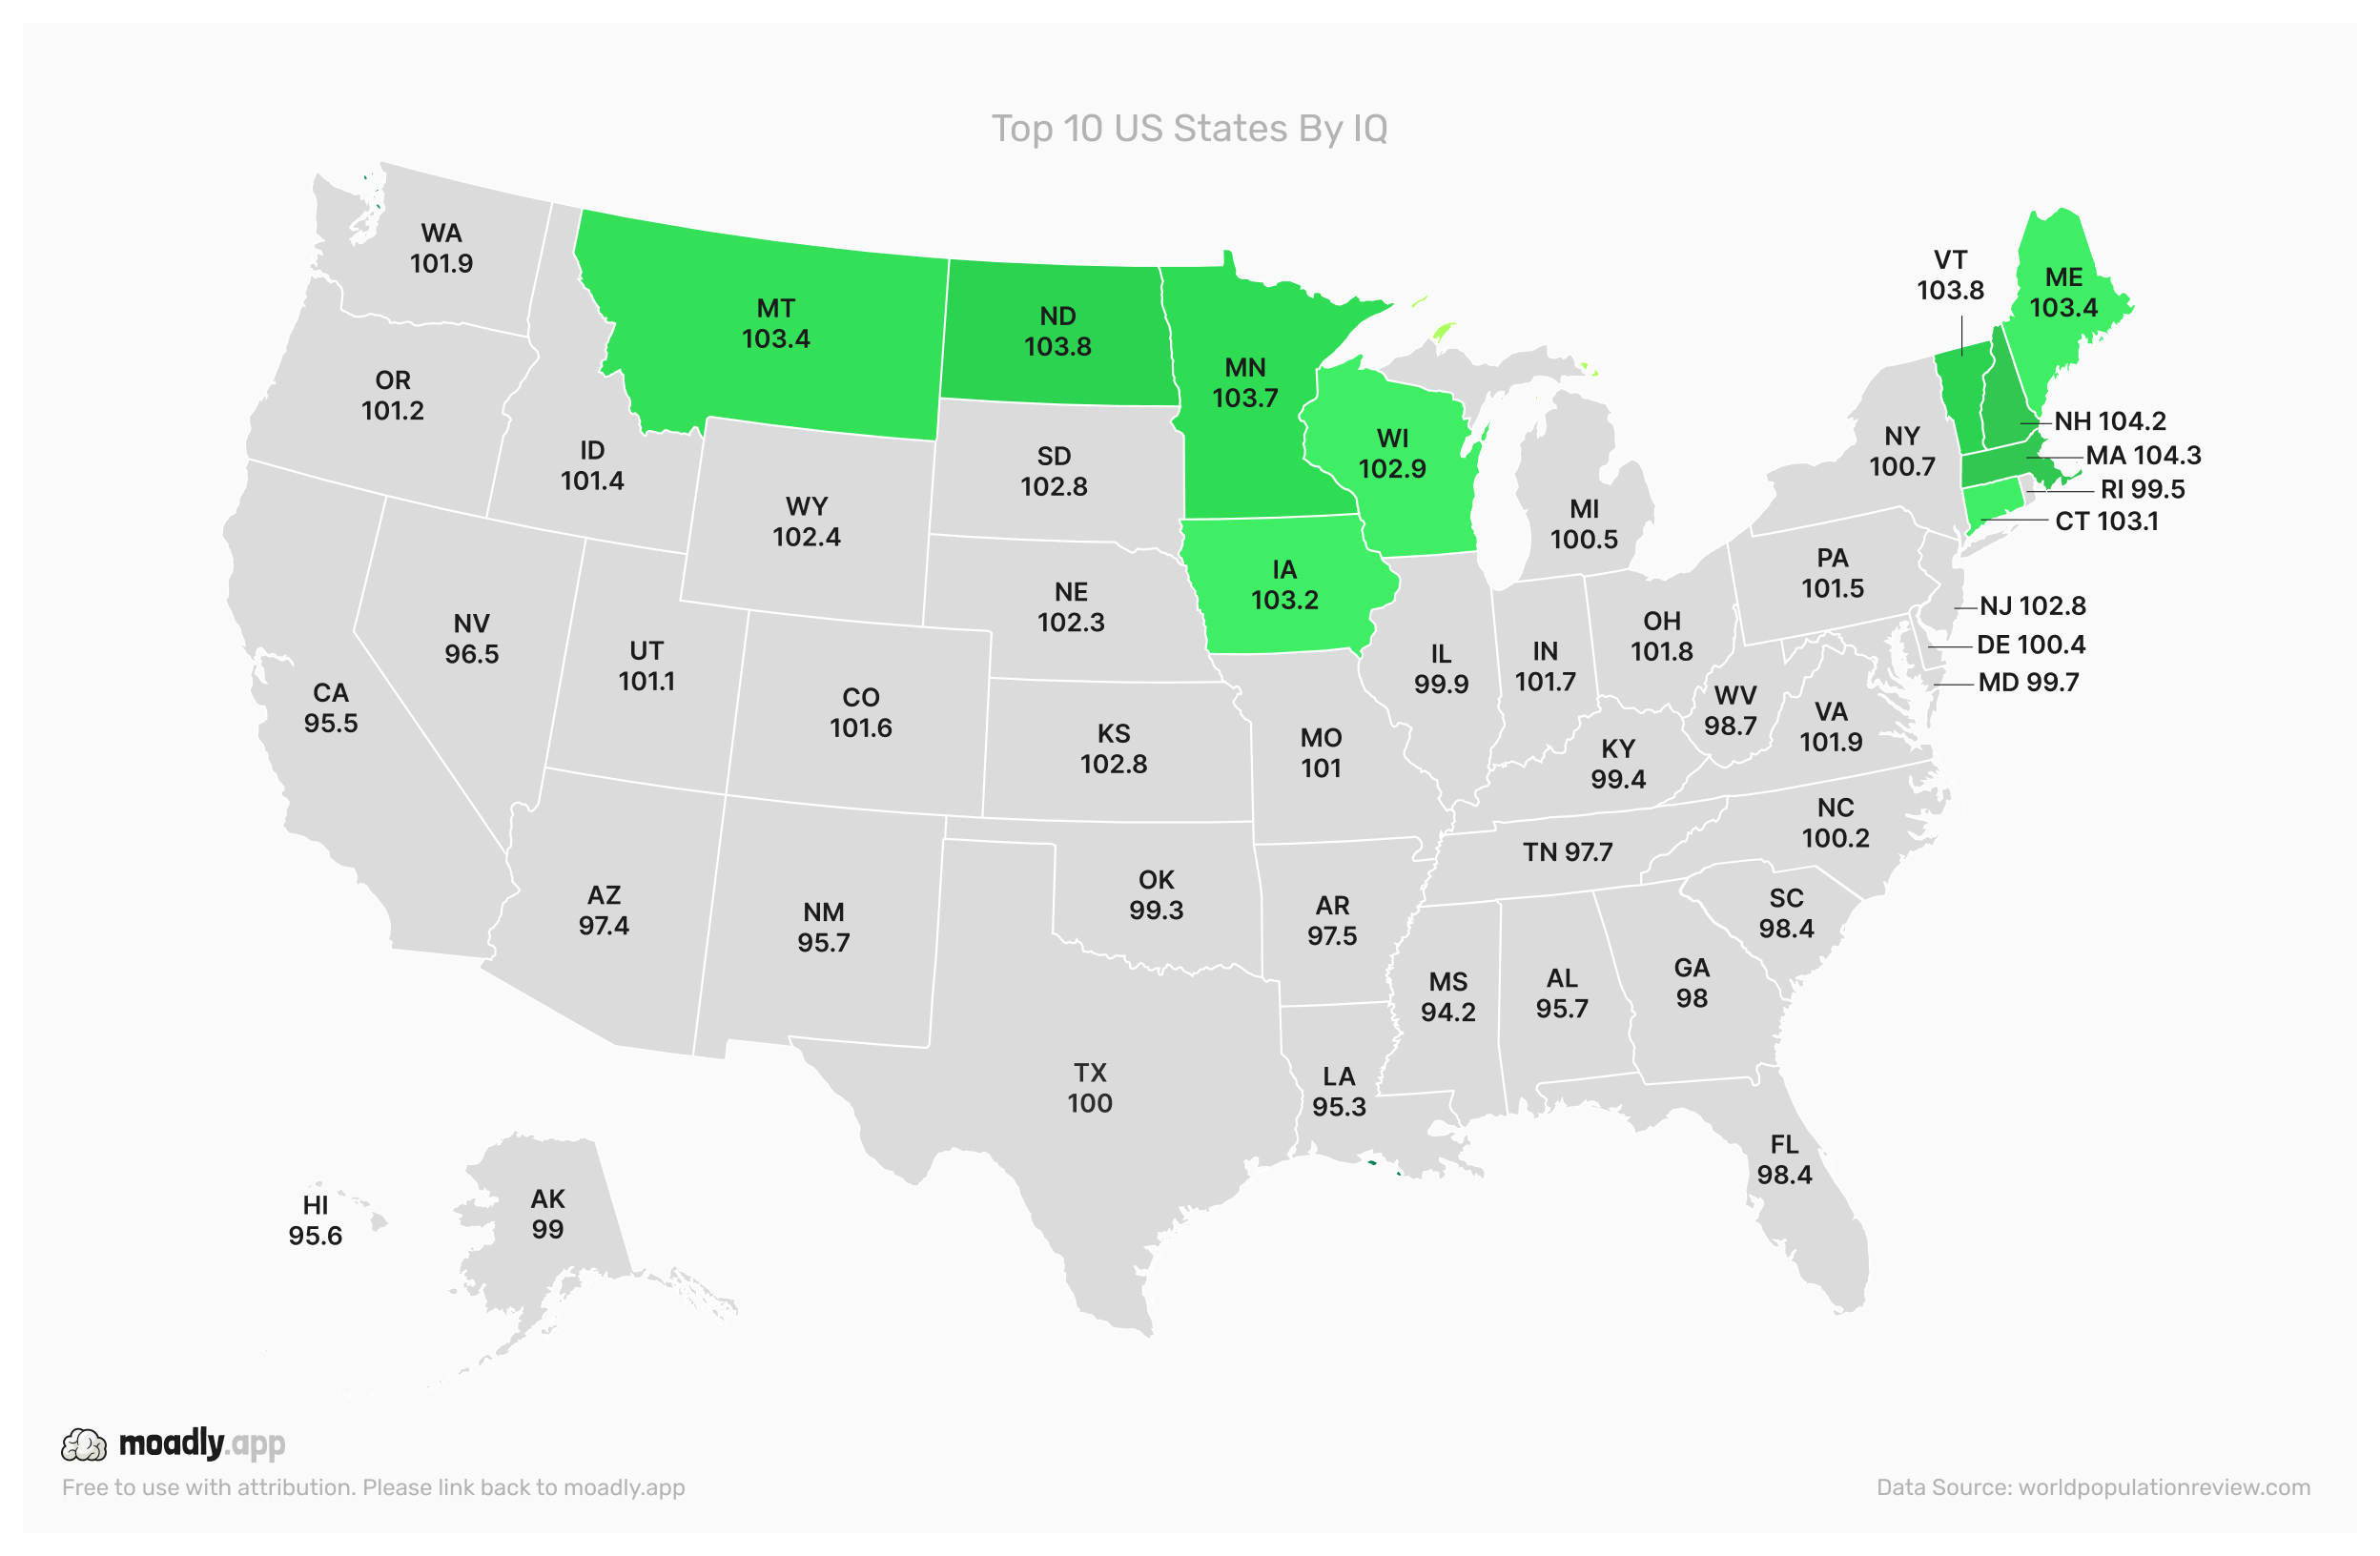
The top 10 states show a clear concentration in the Northeast and Upper Midwest. Strong public school systems, community engagement, and higher median household incomes contribute to these results.
4. California vs. Texas Average IQ Comparison
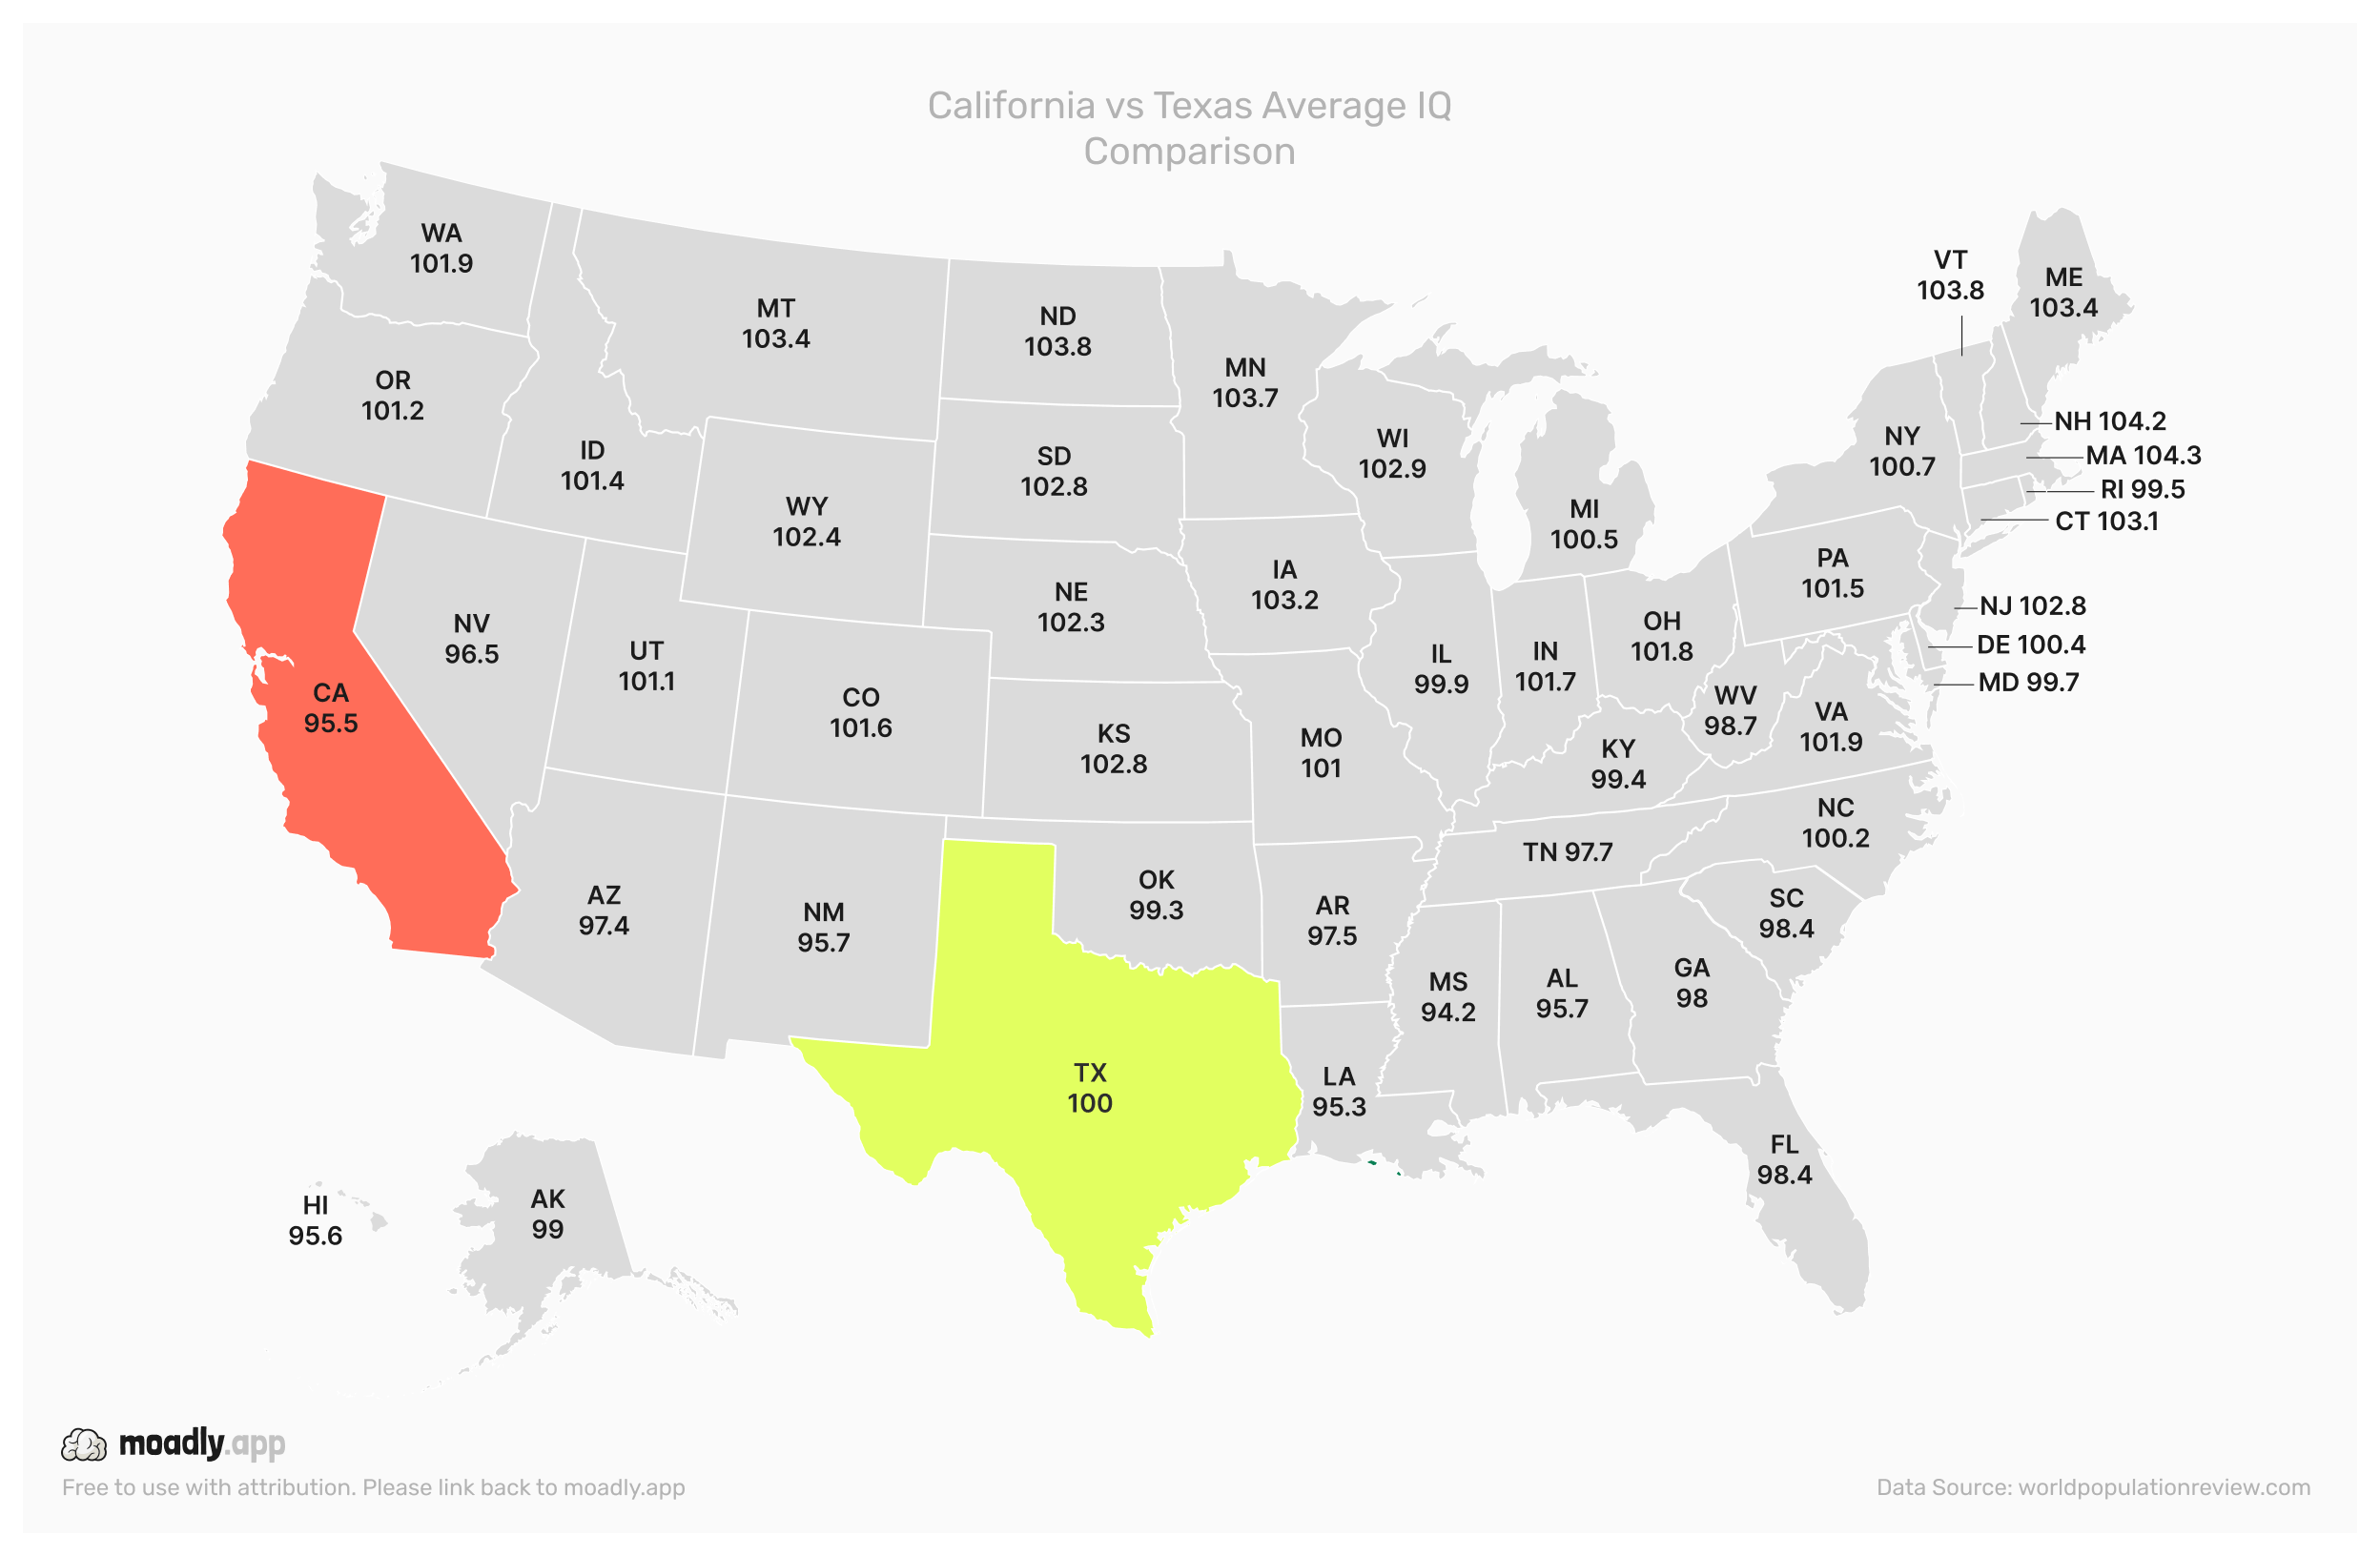
This comparison illustrates a 5-point difference between California (95.5) and Texas (100). While Texas benefits from a more uniform education system, California's large and diverse population influences its average IQ downward.
5. Illinois vs. Tennessee Average IQ Comparison
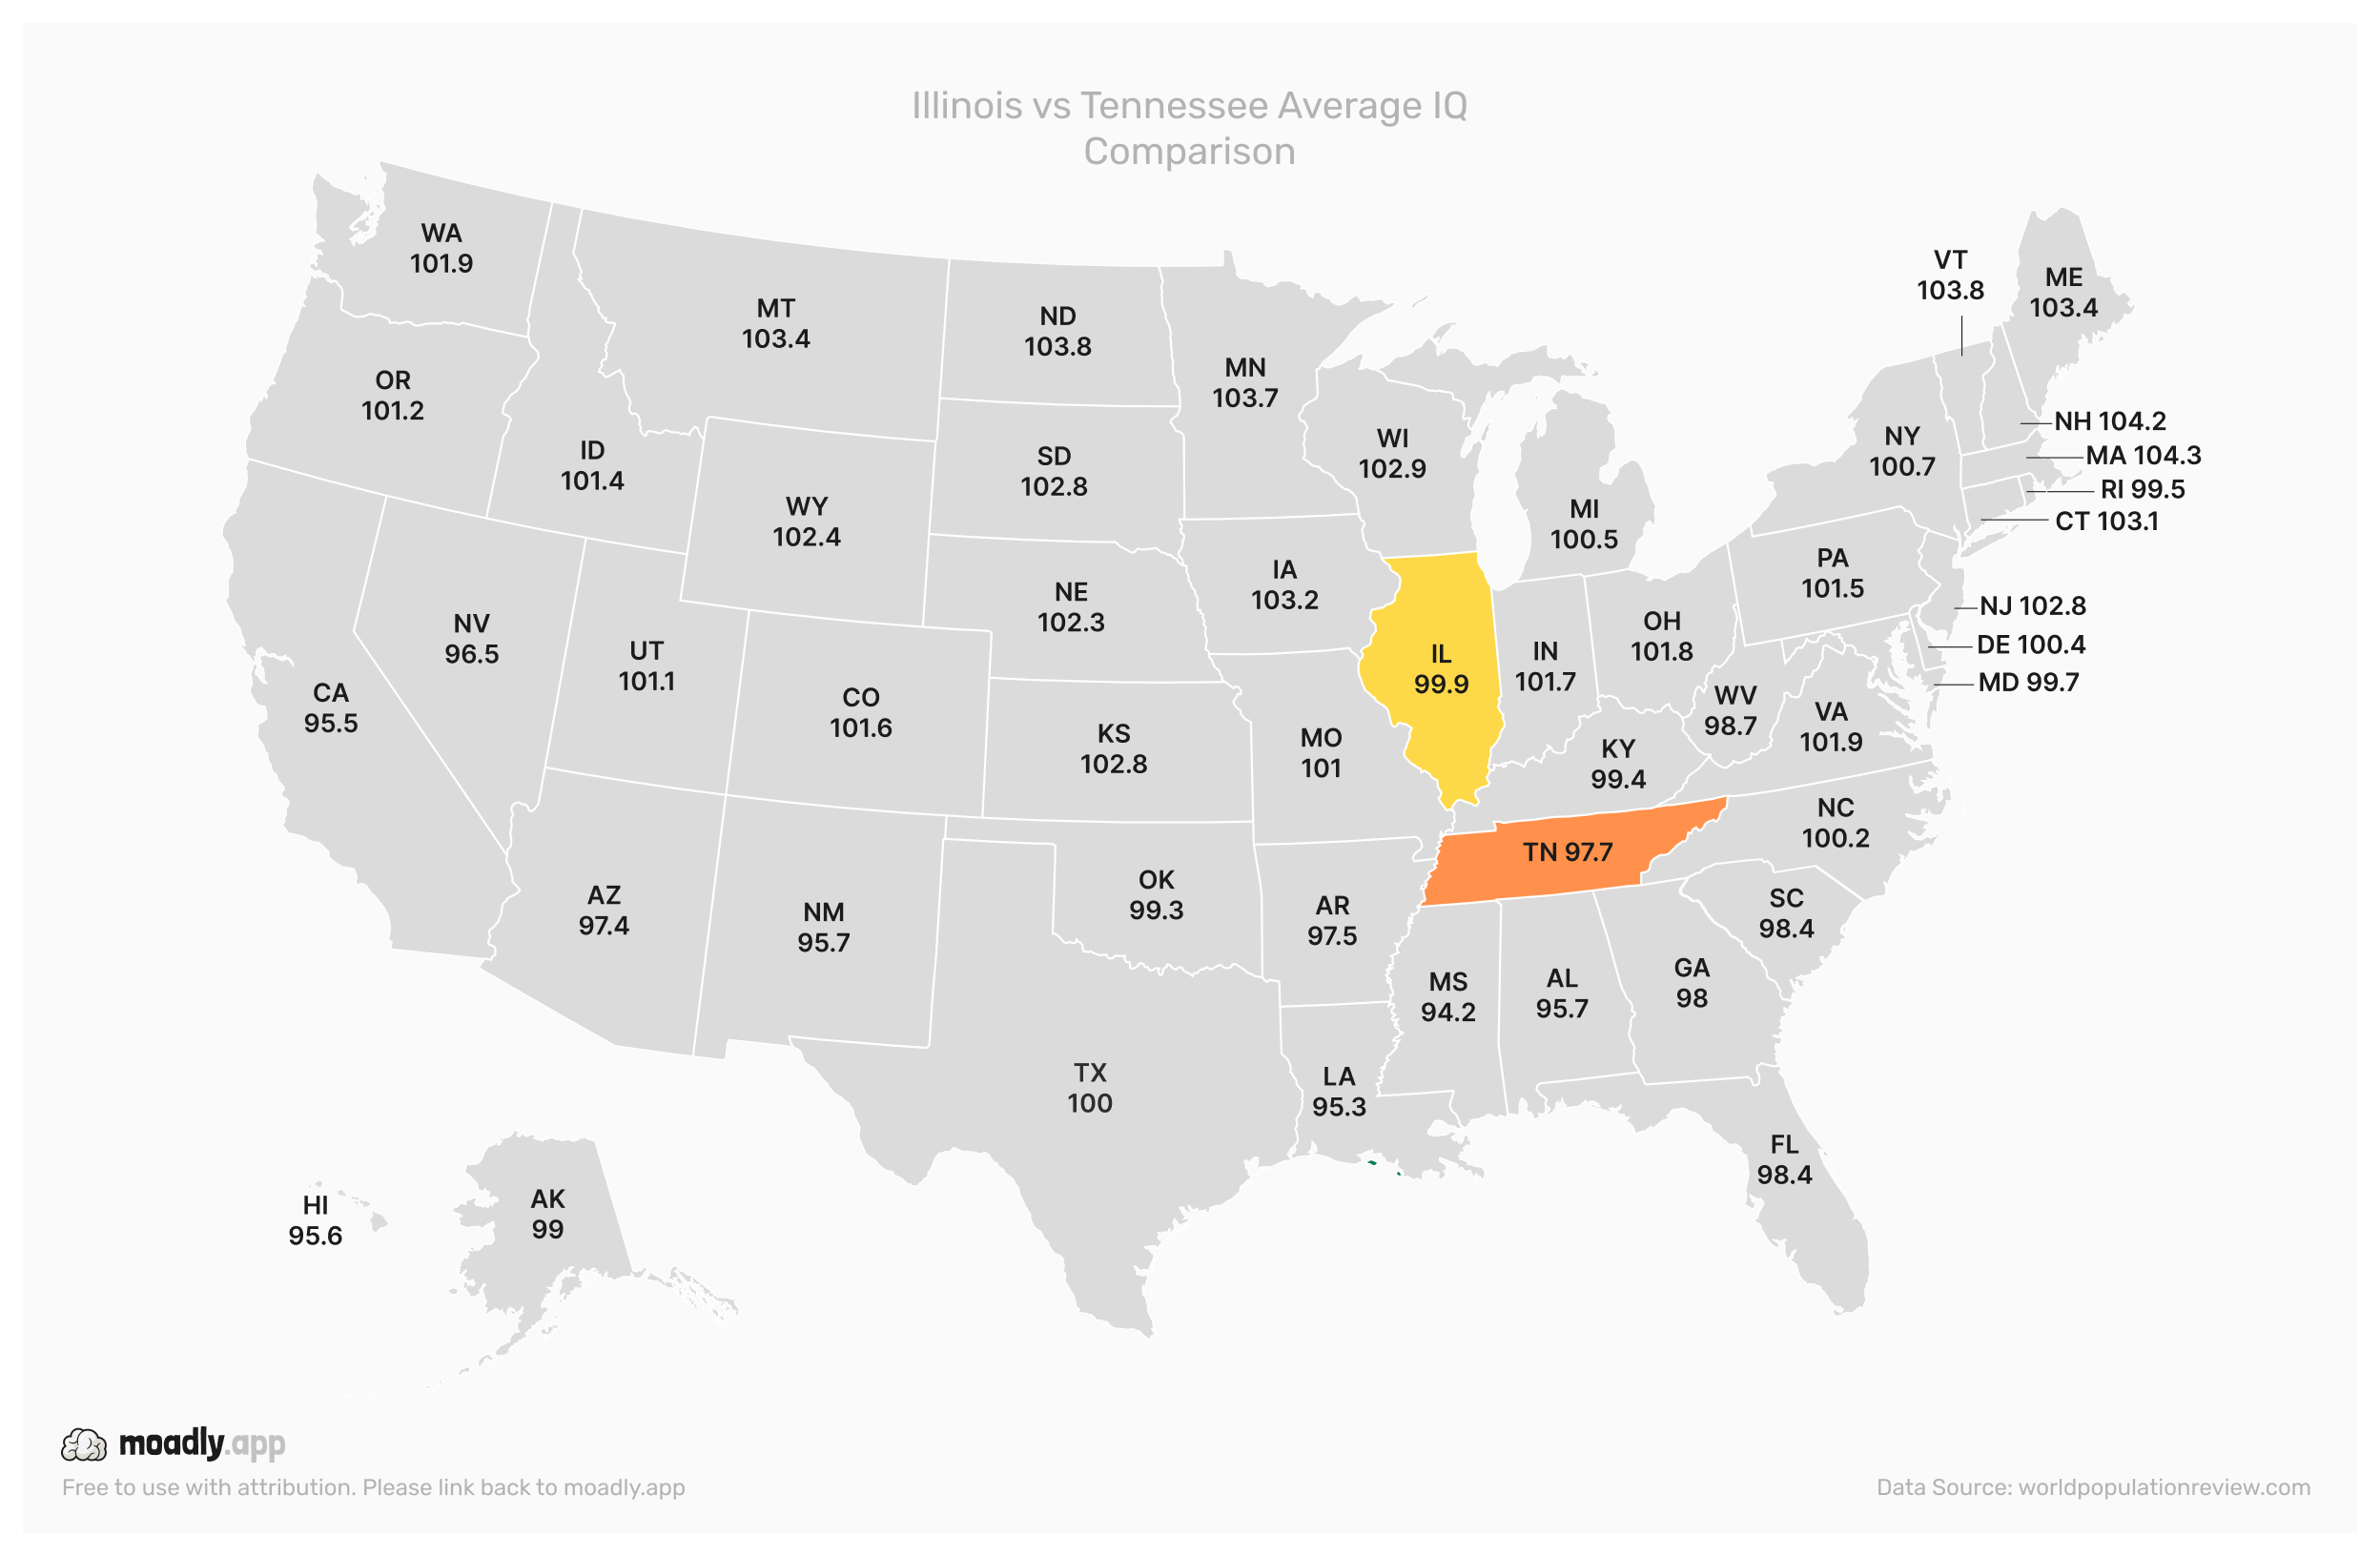
Illinois (99.9) and Tennessee (97.7) show a 2.2-point gap, demonstrating regional variation even within the Midwest and South. Economic disparities and educational investment are key contributing factors.
6. Massachusetts vs. Alabama Average IQ Comparison
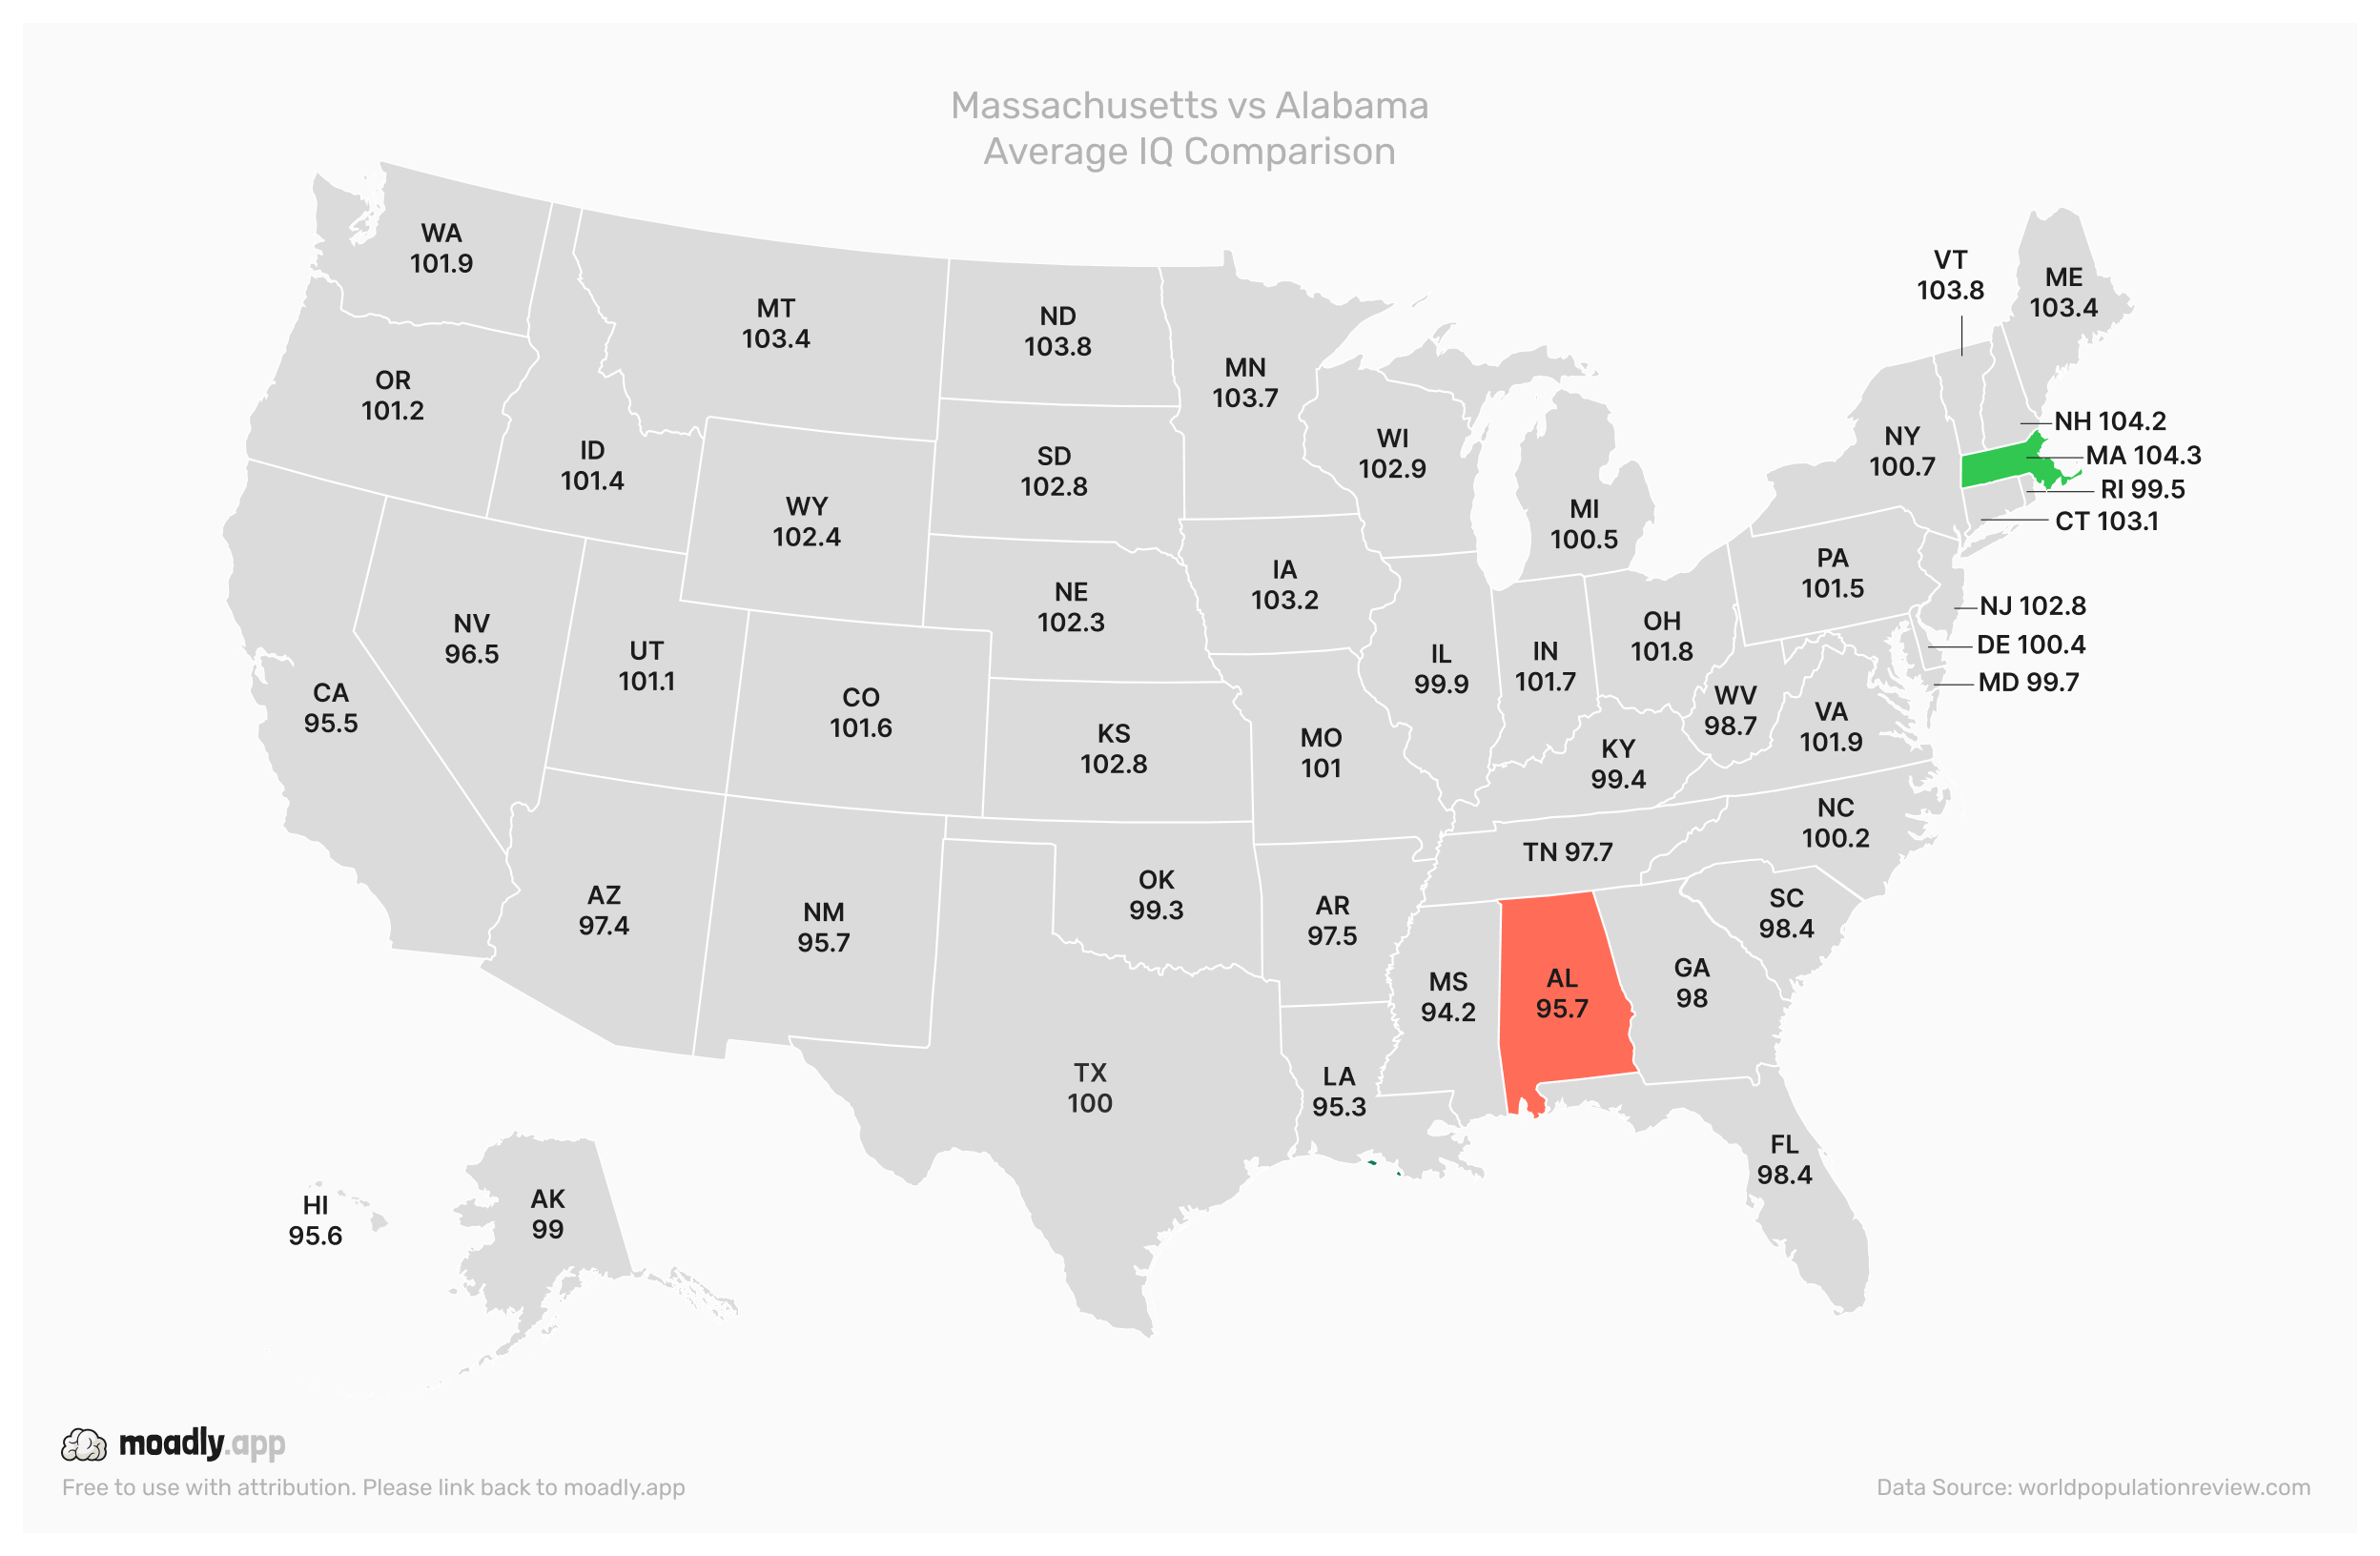
Massachusetts (104.3) leads the country, while Alabama (95.7) sits near the lower end. This 8.6-point difference highlights the influence of education quality and early childhood learning programs.
7. New York vs. Florida Average IQ Comparison
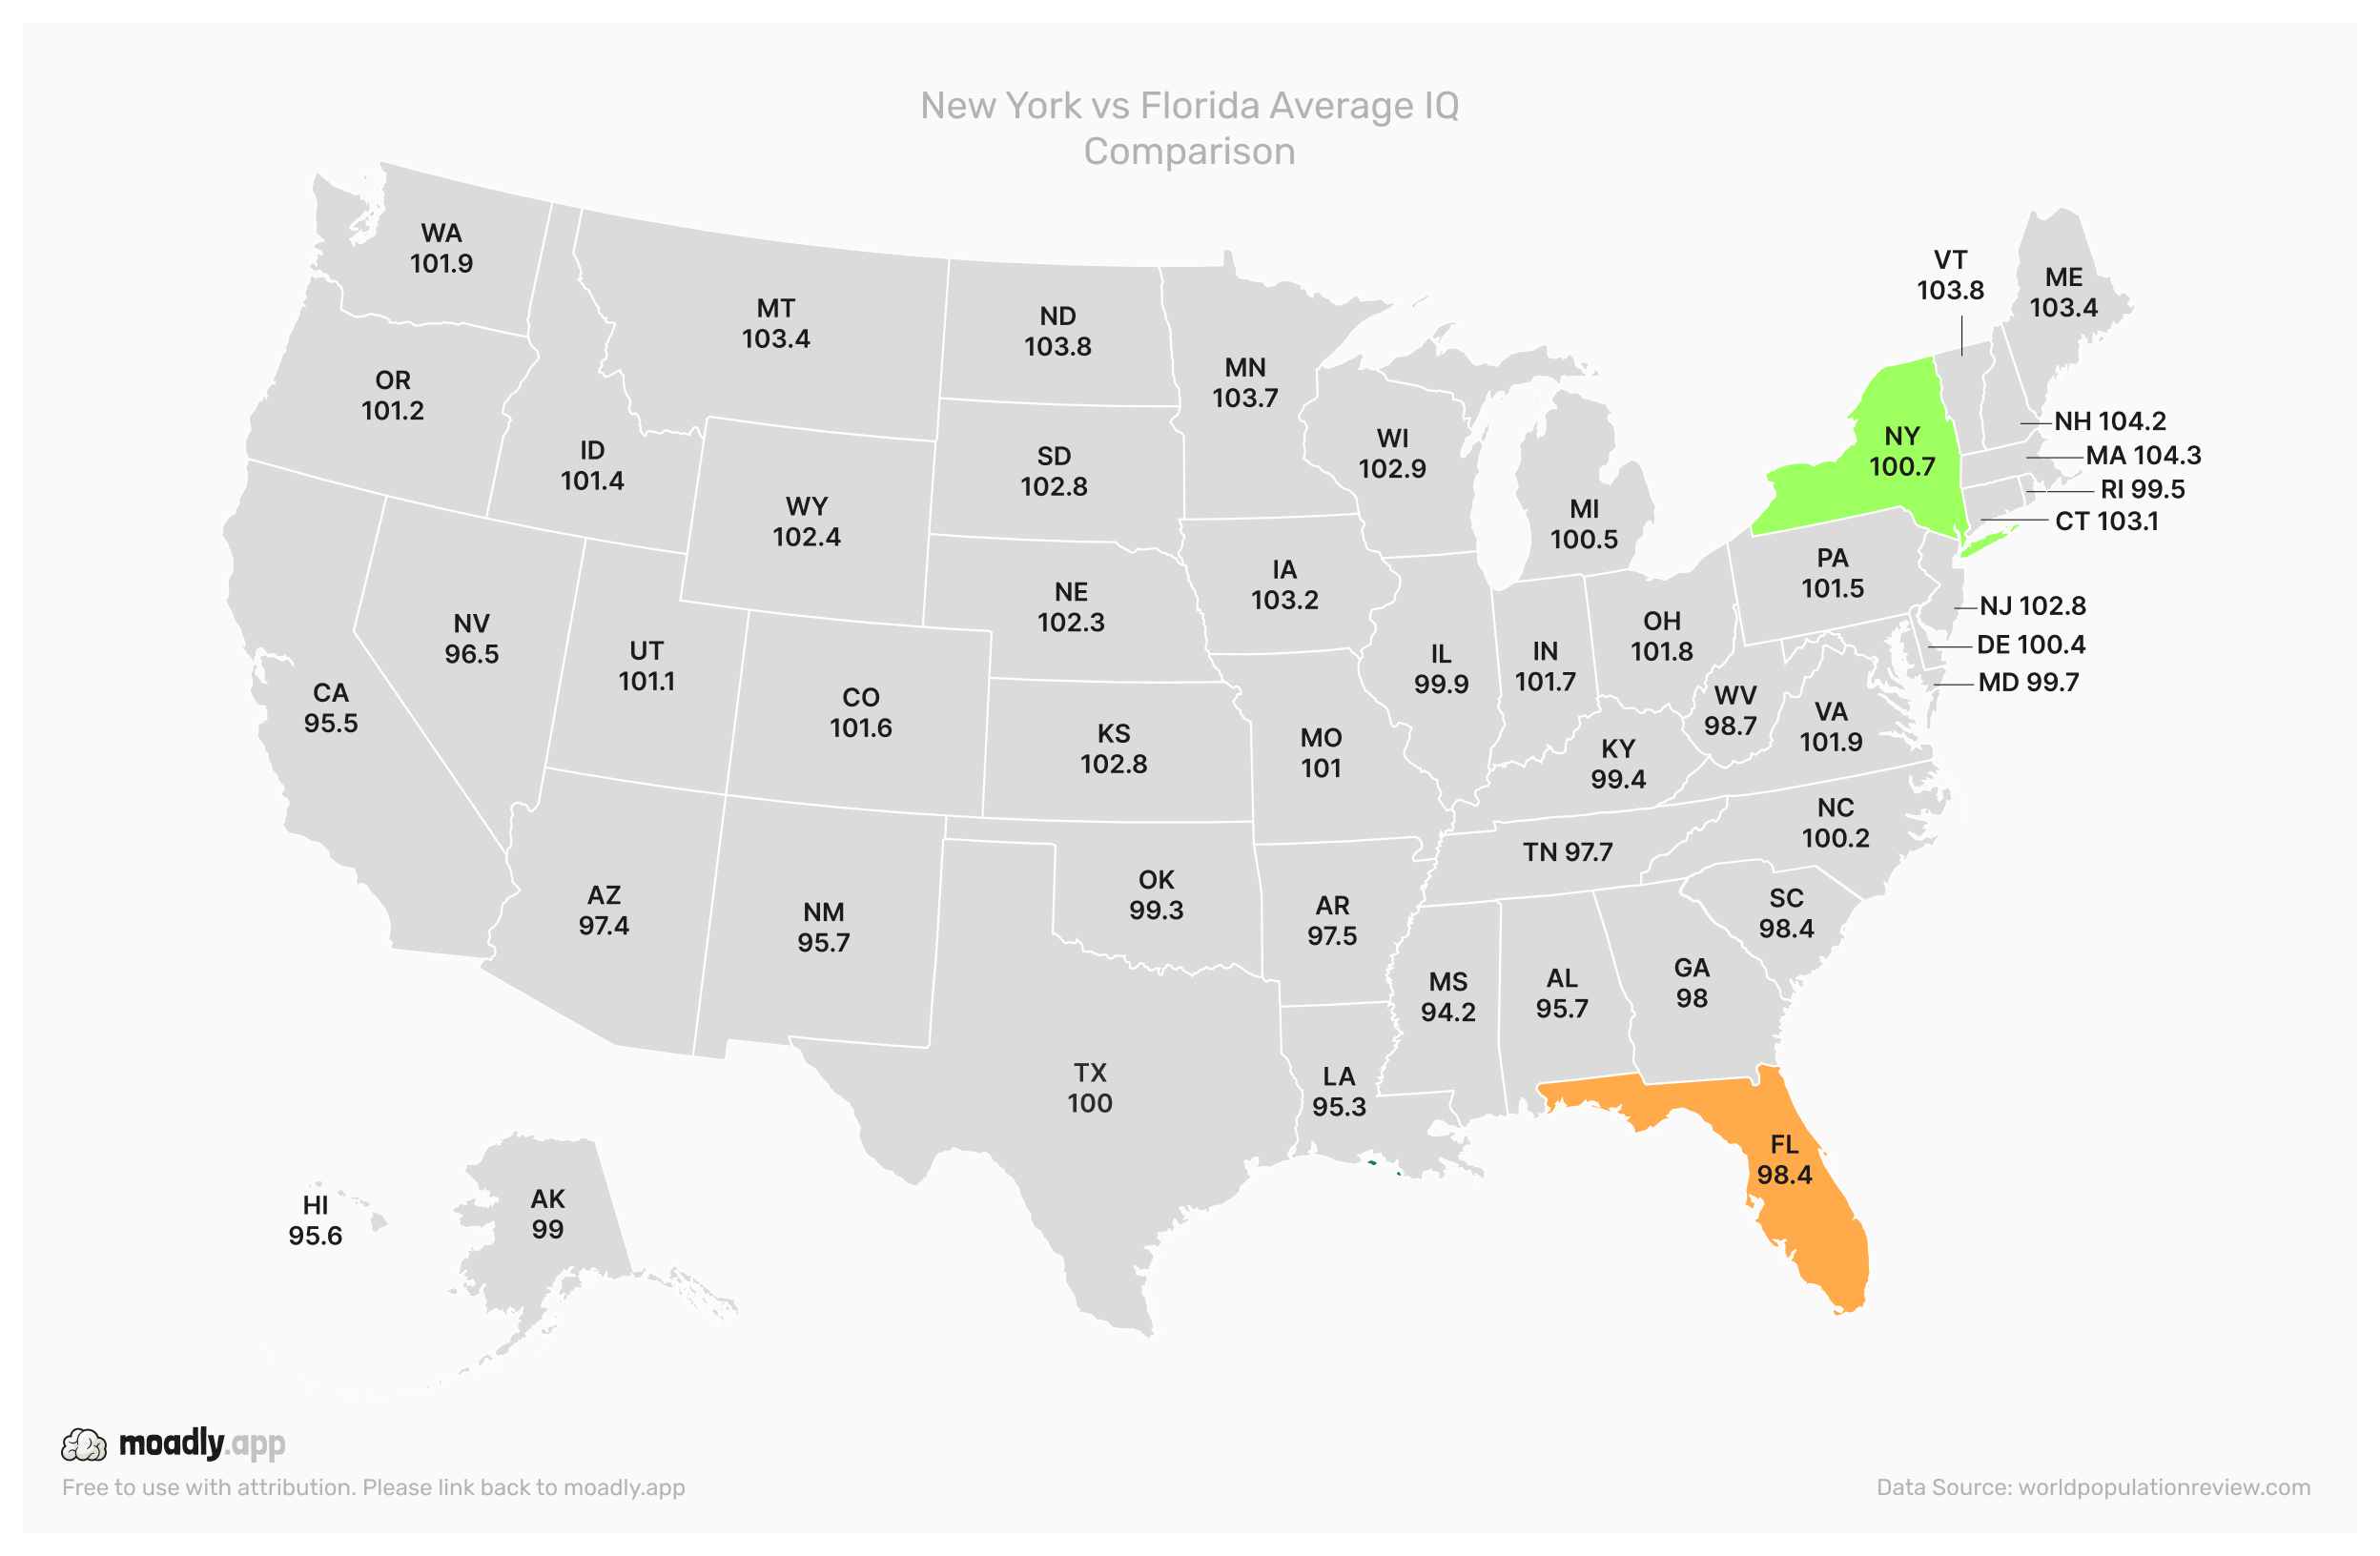
New York (100.7) slightly outperforms Florida (98.4). This gap reflects differences in educational attainment and regional socioeconomic factors.
8. Washington vs. Oklahoma Average IQ Comparison
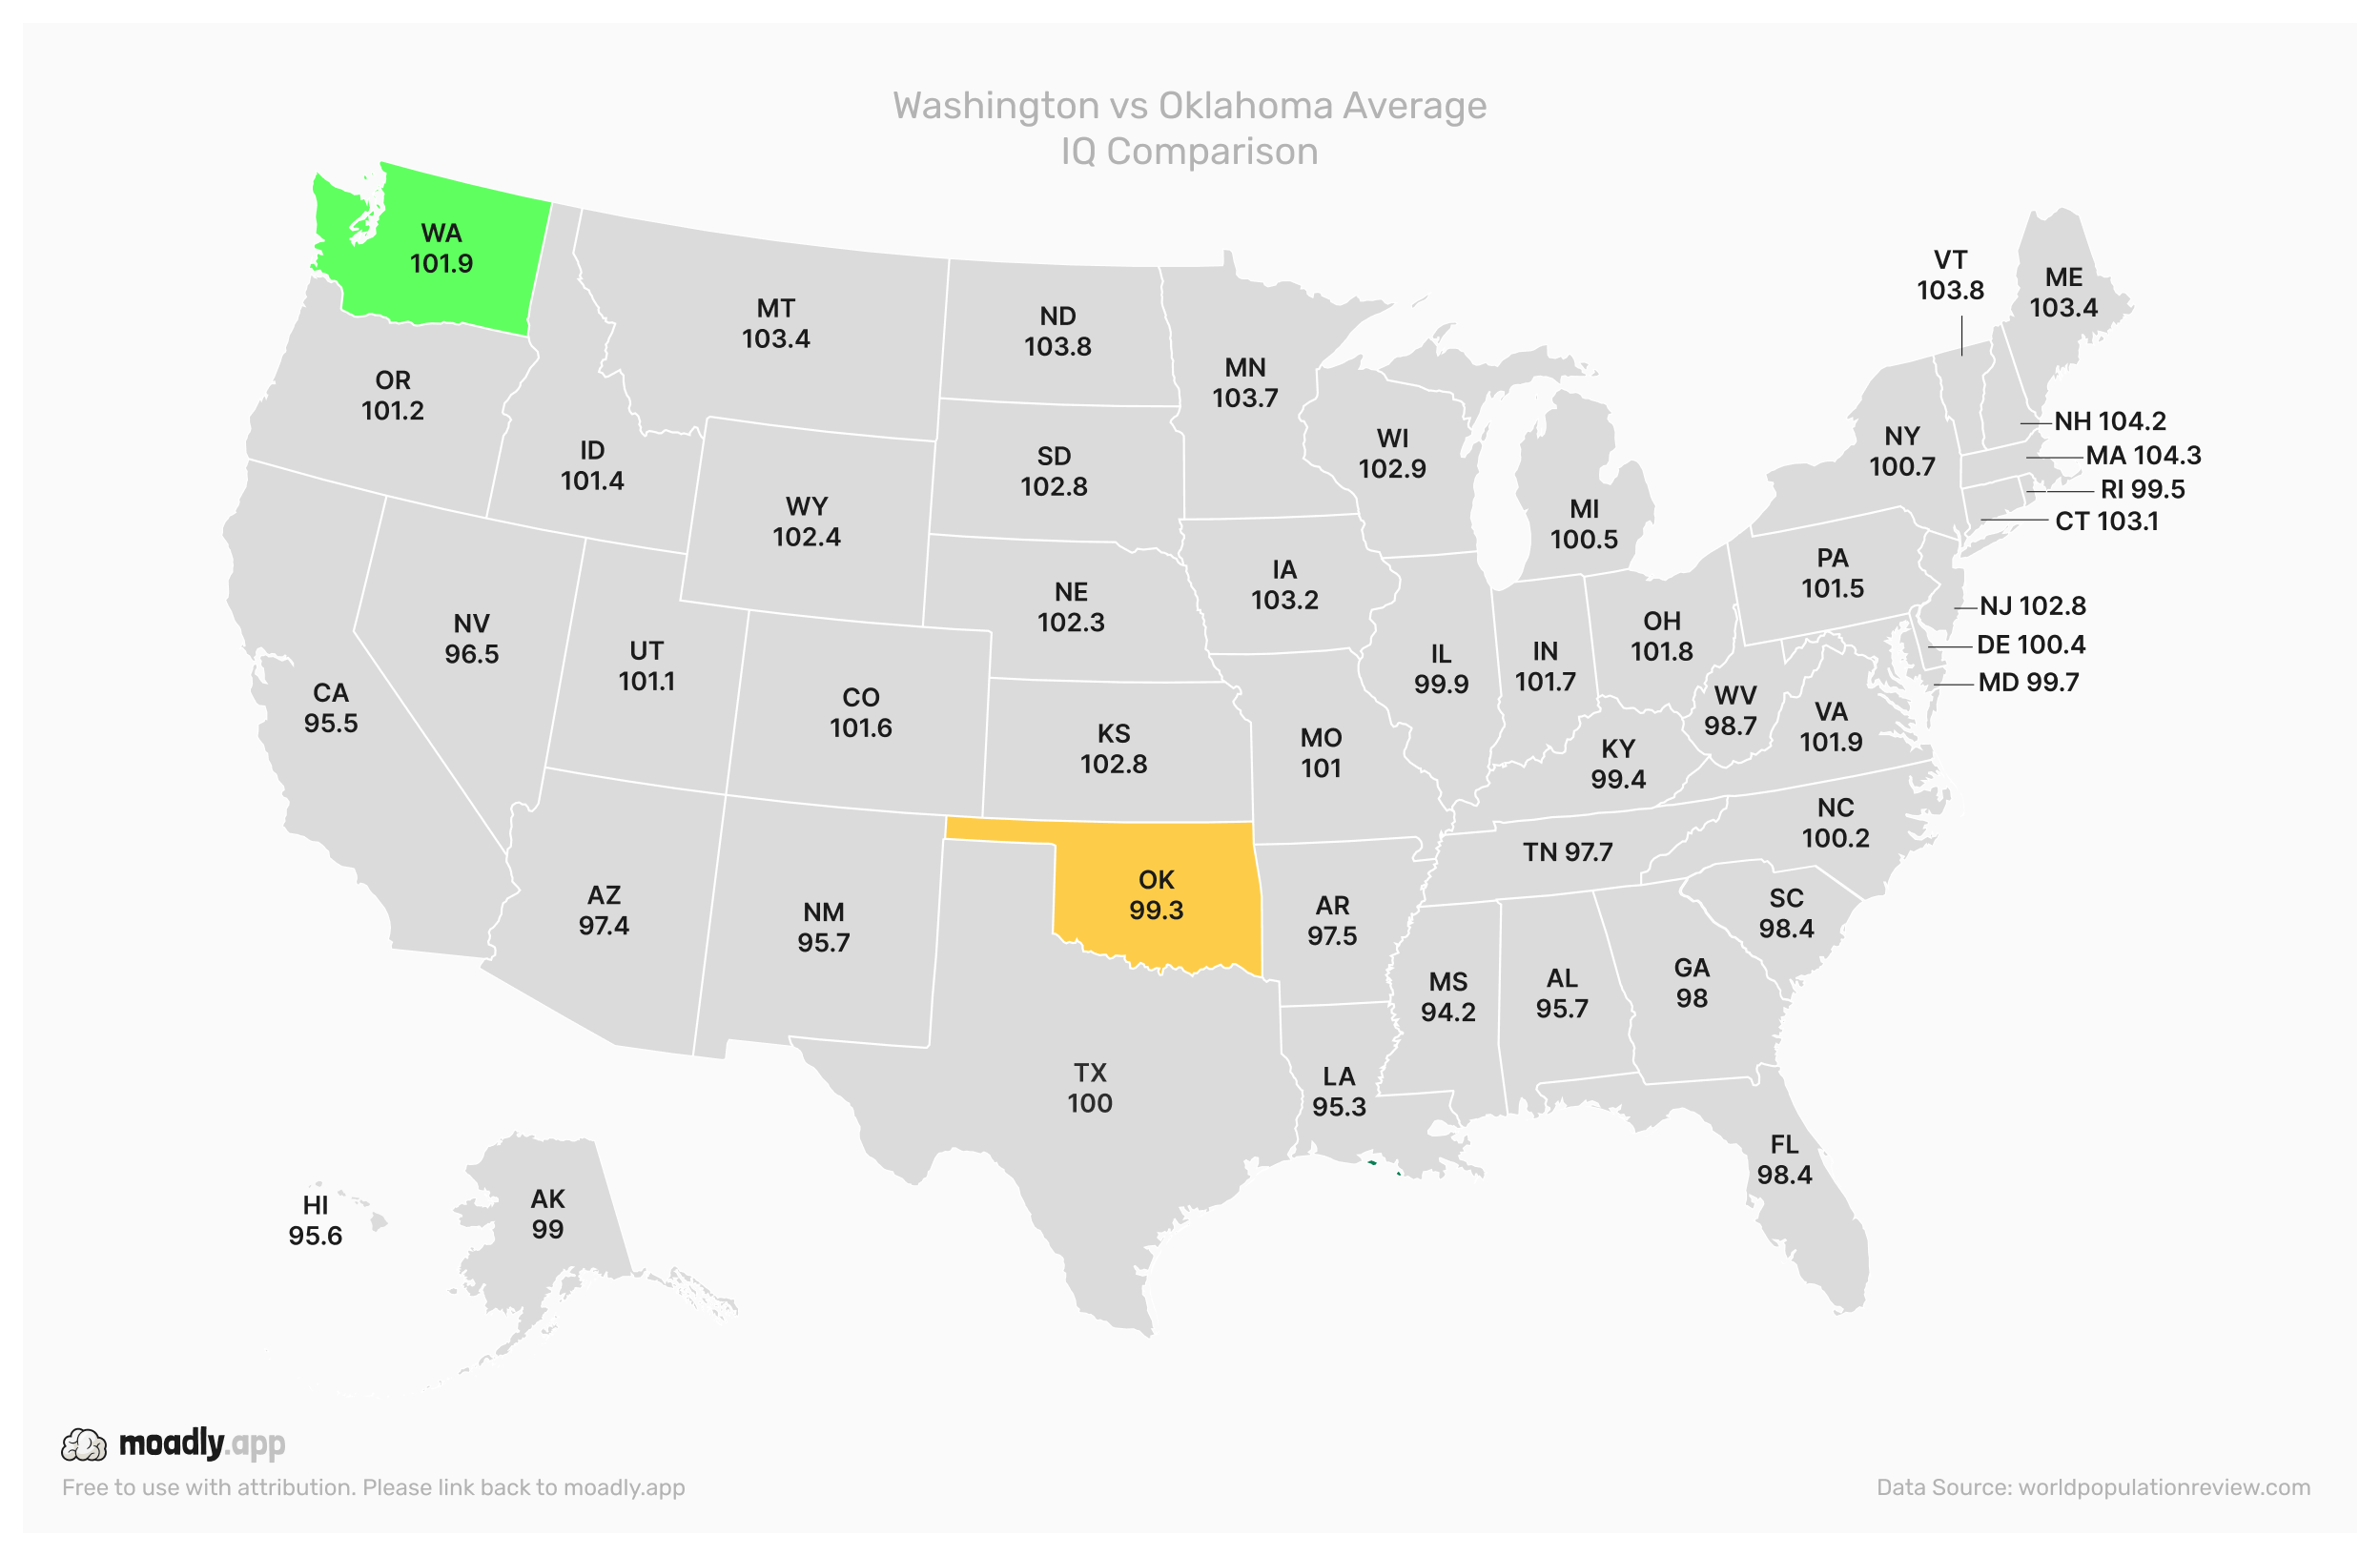
Washington (101.9) vs. Oklahoma (99.3) highlights how Western states generally maintain higher IQ averages due to urbanization and stronger school systems.
9. U.S. Midwest State IQ Comparison
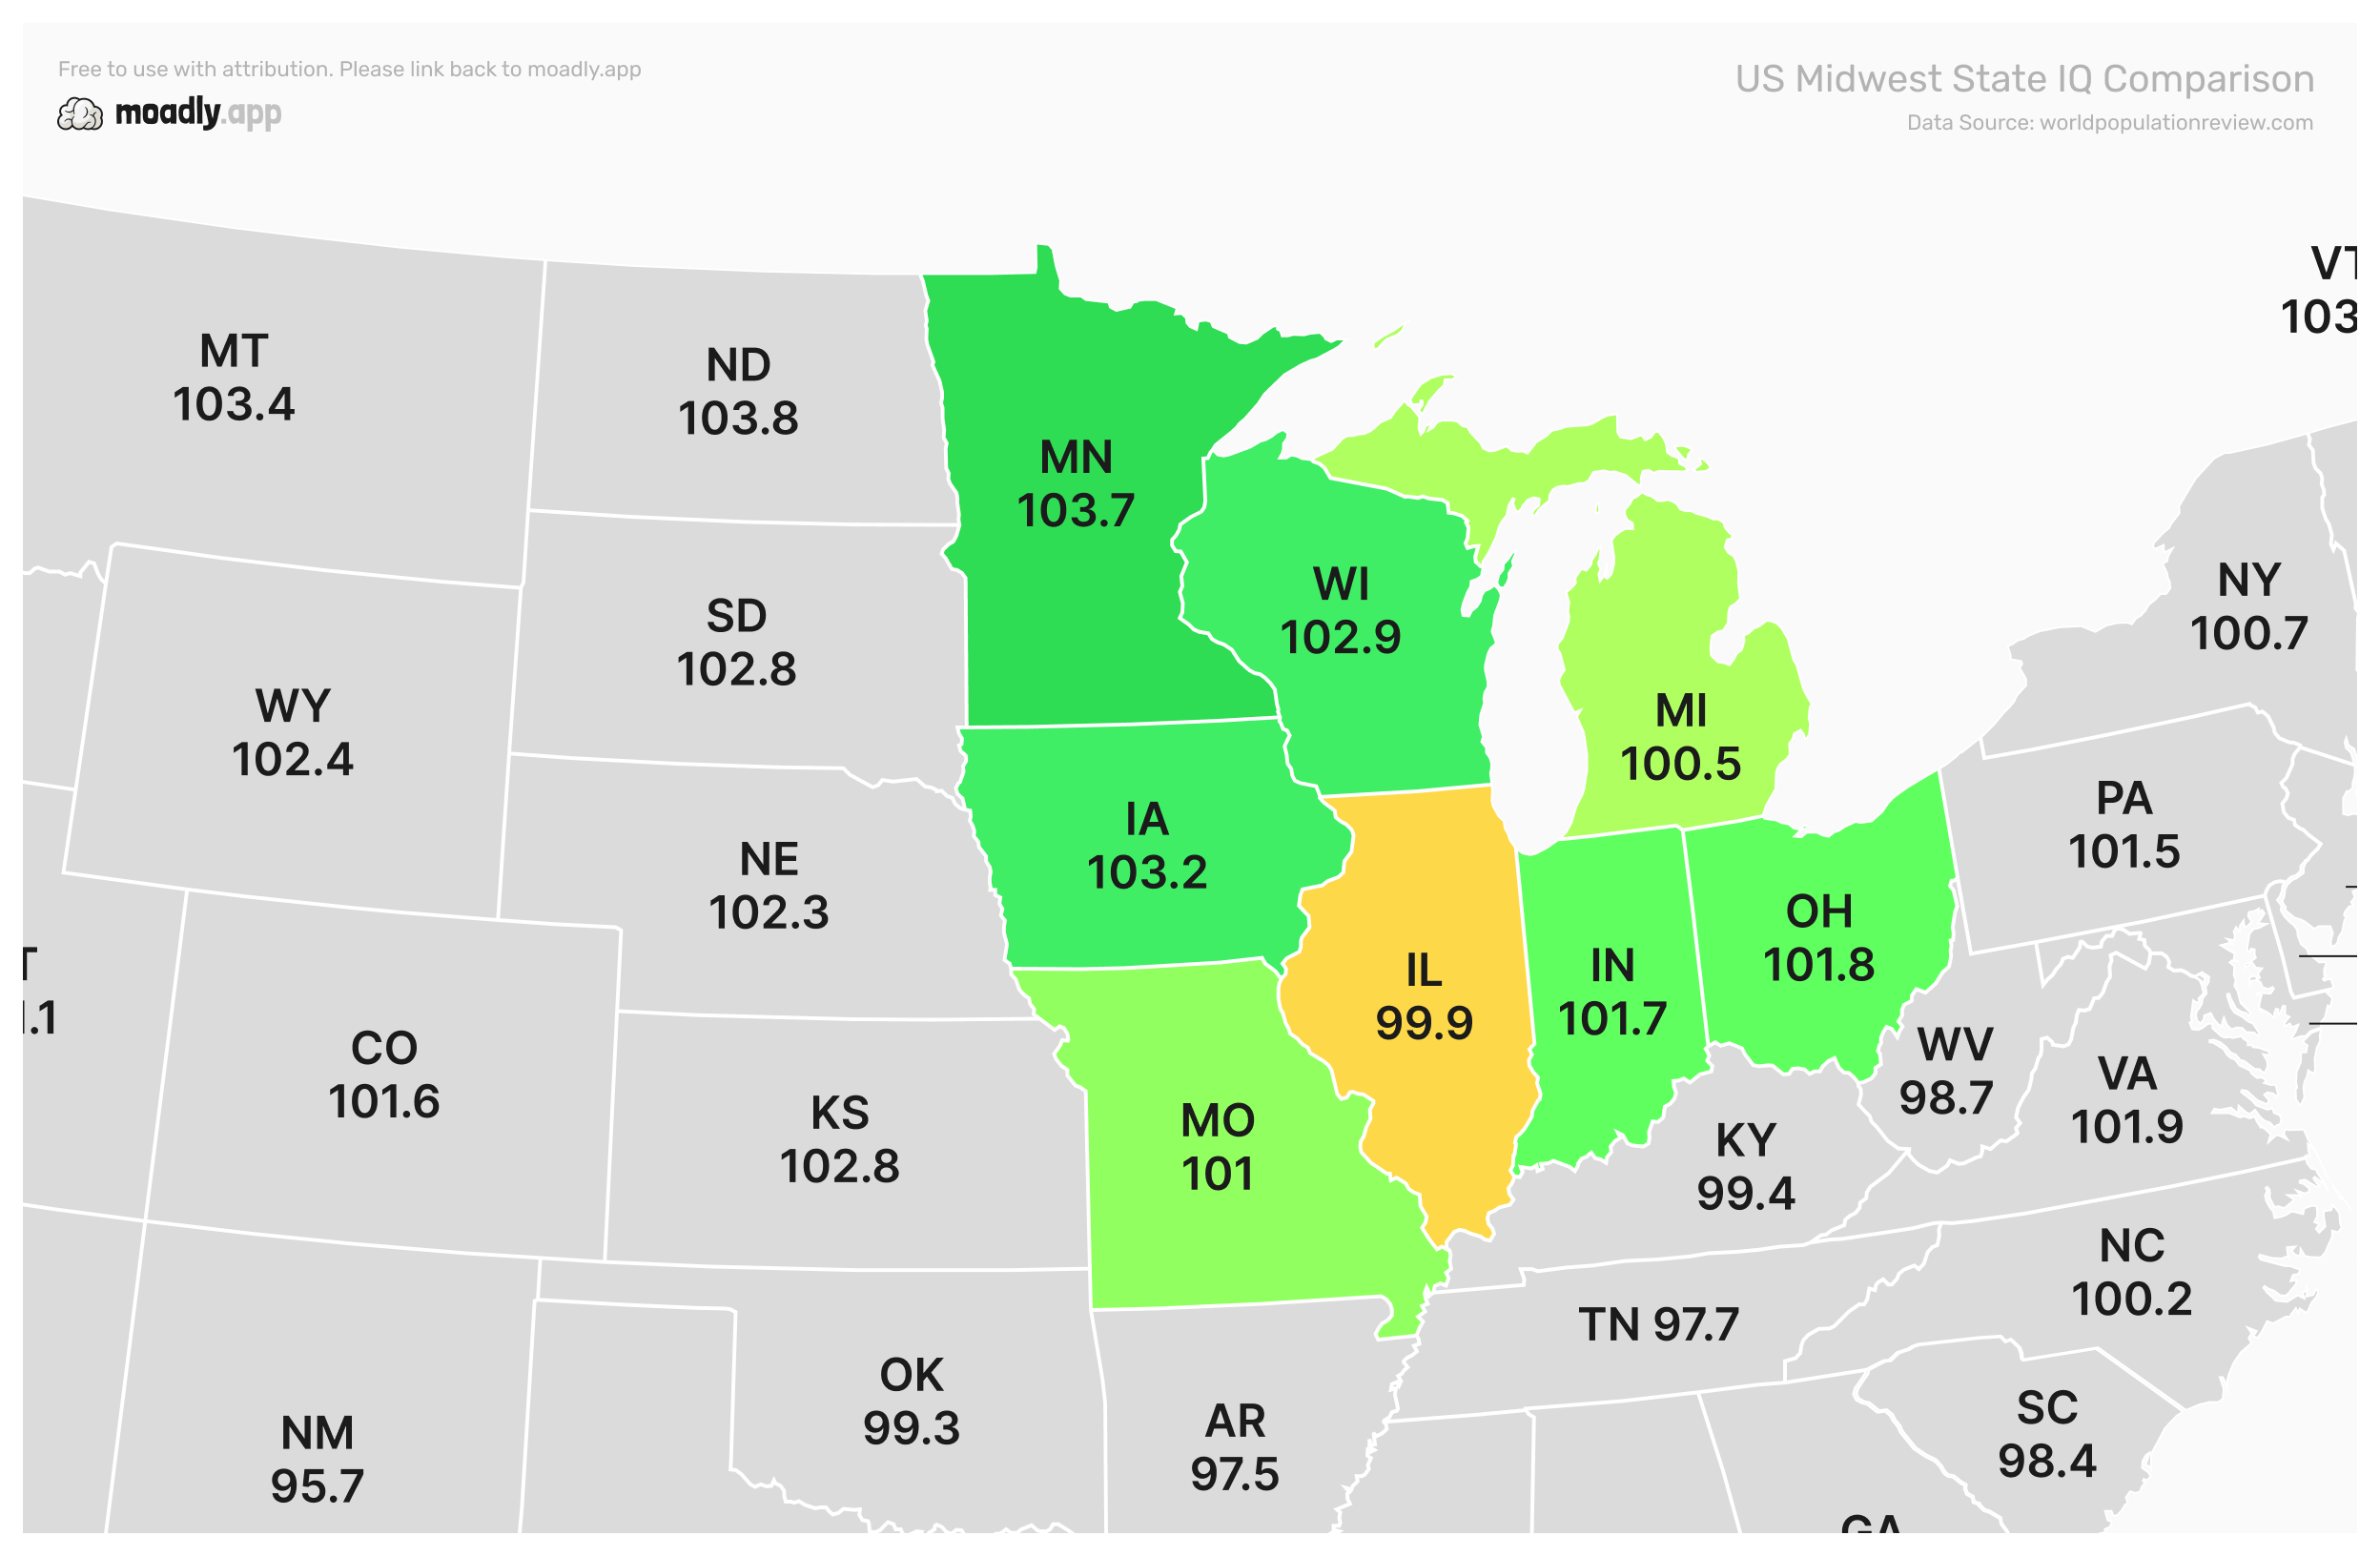
The Midwest consistently demonstrates high IQ averages, with states like Minnesota, Iowa, and Wisconsin exceeding 102. Strong local school funding and community emphasis on literacy are key factors.
10. U.S. South State IQ Comparison

Southern states display lower IQ averages overall. Economic inequalities, rural schooling challenges, and historical disparities affect regional cognitive performance.
11. U.S. Southwest State IQ Comparison

Southwestern states like Arizona, New Mexico, and Nevada trend slightly below the national average, influenced by education and socioeconomic factors in more rural areas.
12. U.S. West Coast State IQ Comparison
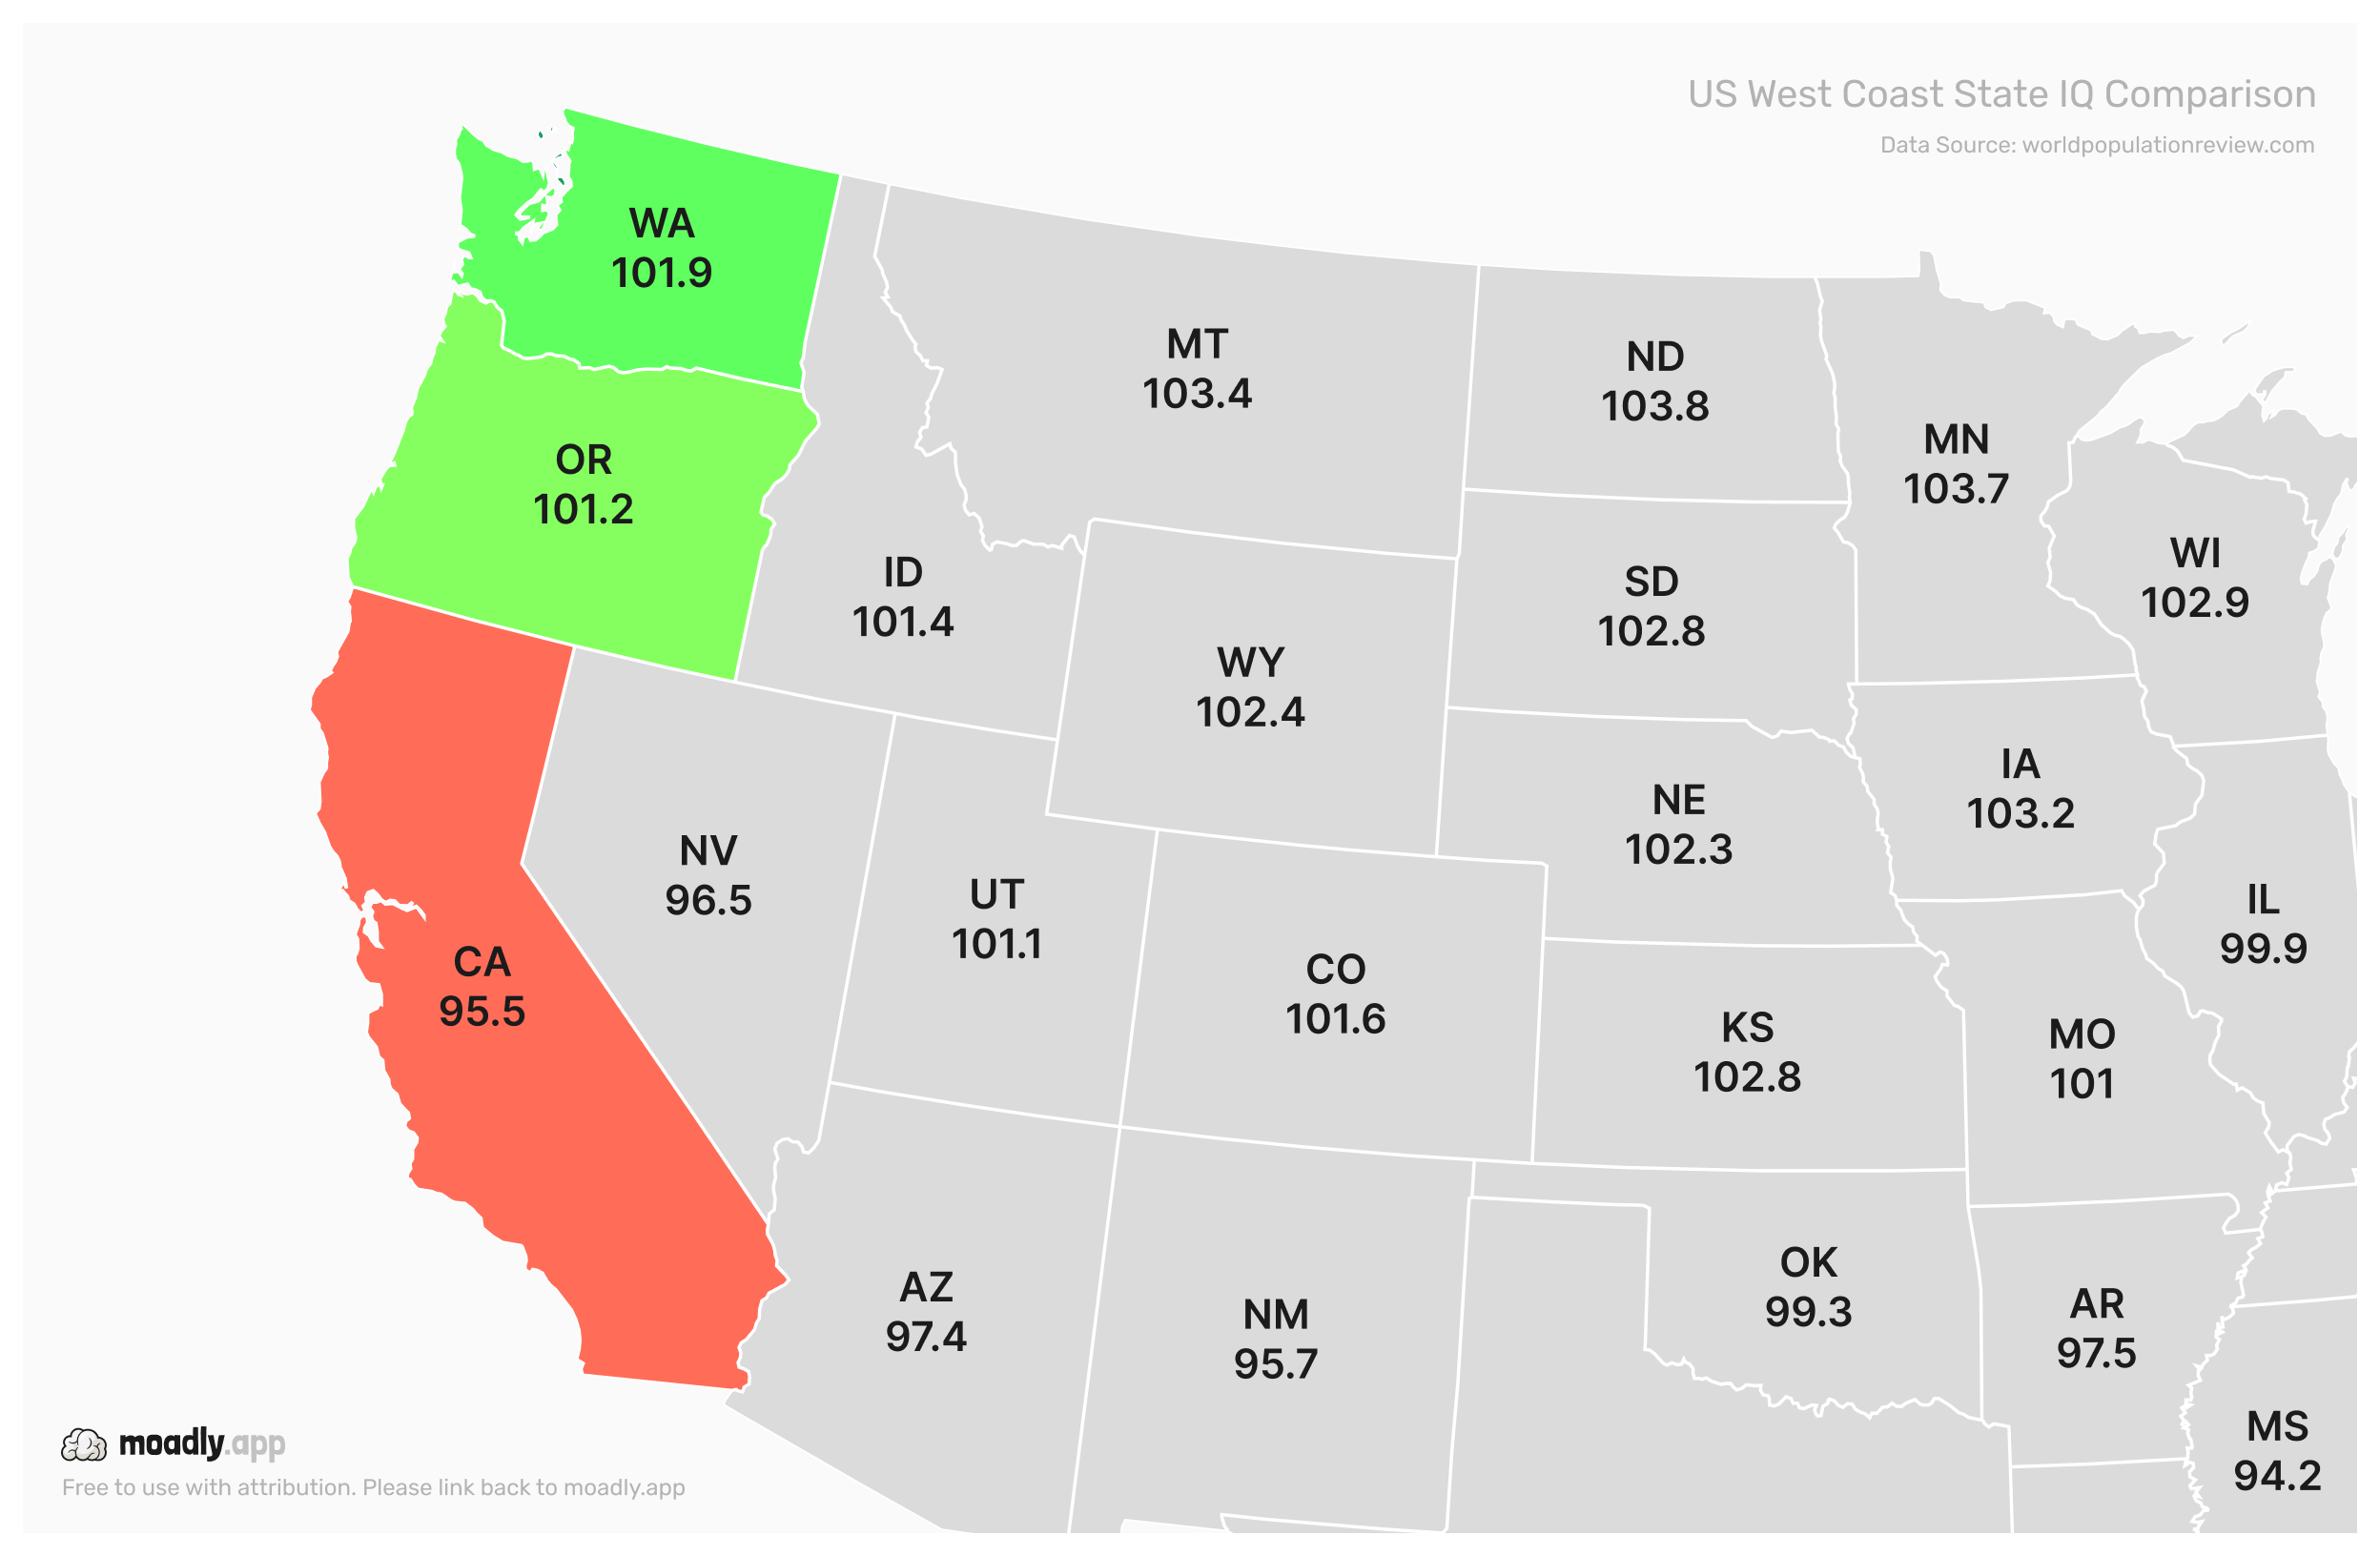
California, Oregon, and Washington show mixed results. While Washington performs above average, California's diverse population lowers its mean IQ relative to other coastal states.
13. California vs. Texas Average IQ Comparison
Finally, a direct state-to-state comparison reiterates the importance of demographics, migration, and schooling policy on average IQ. Texas benefits from a more homogeneous educational infrastructure, while California reflects a larger, more heterogeneous population.
Average IQ in Alabama
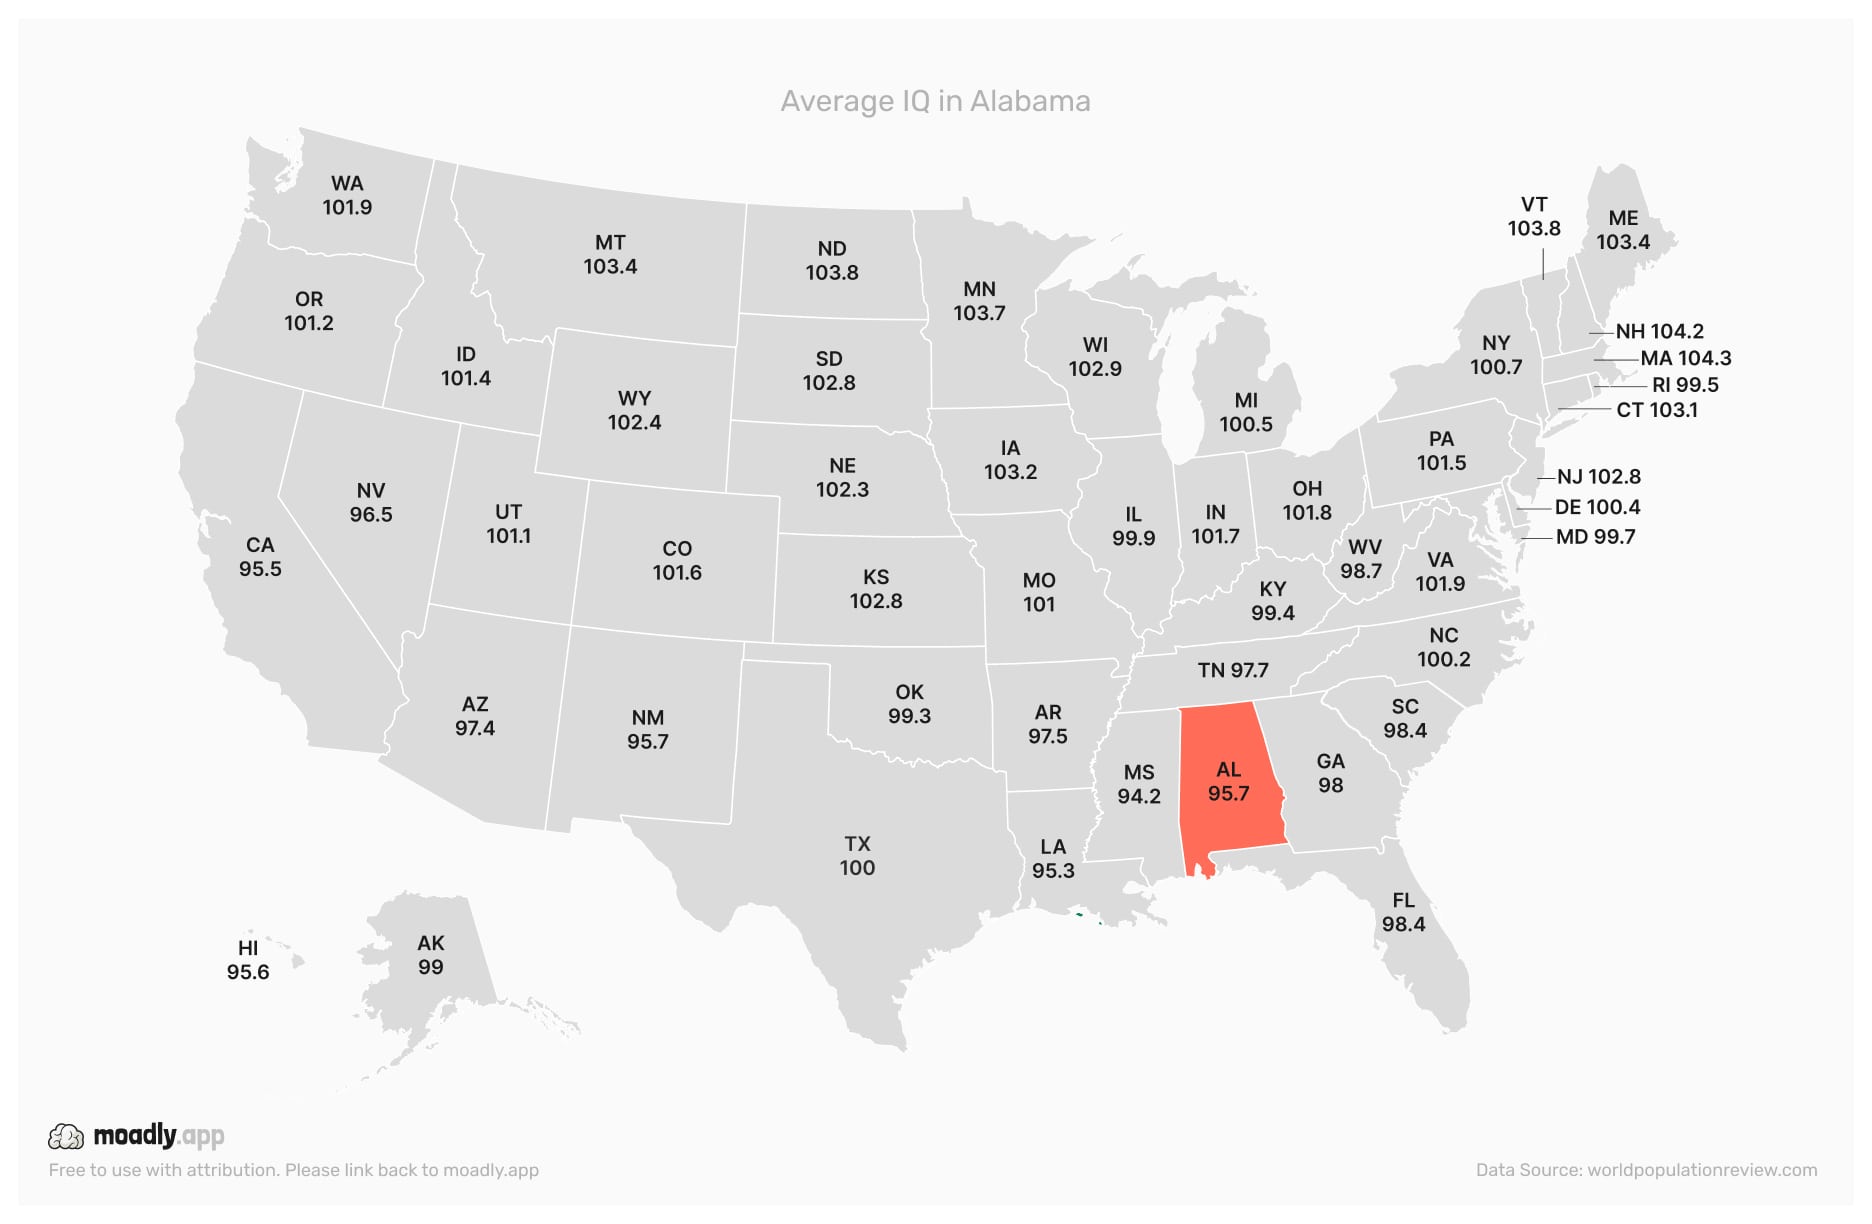
Alabama's education system reflects a mix of urban and rural challenges, with funding differences influencing the state’s average IQ outcomes.
Average IQ in Alaska
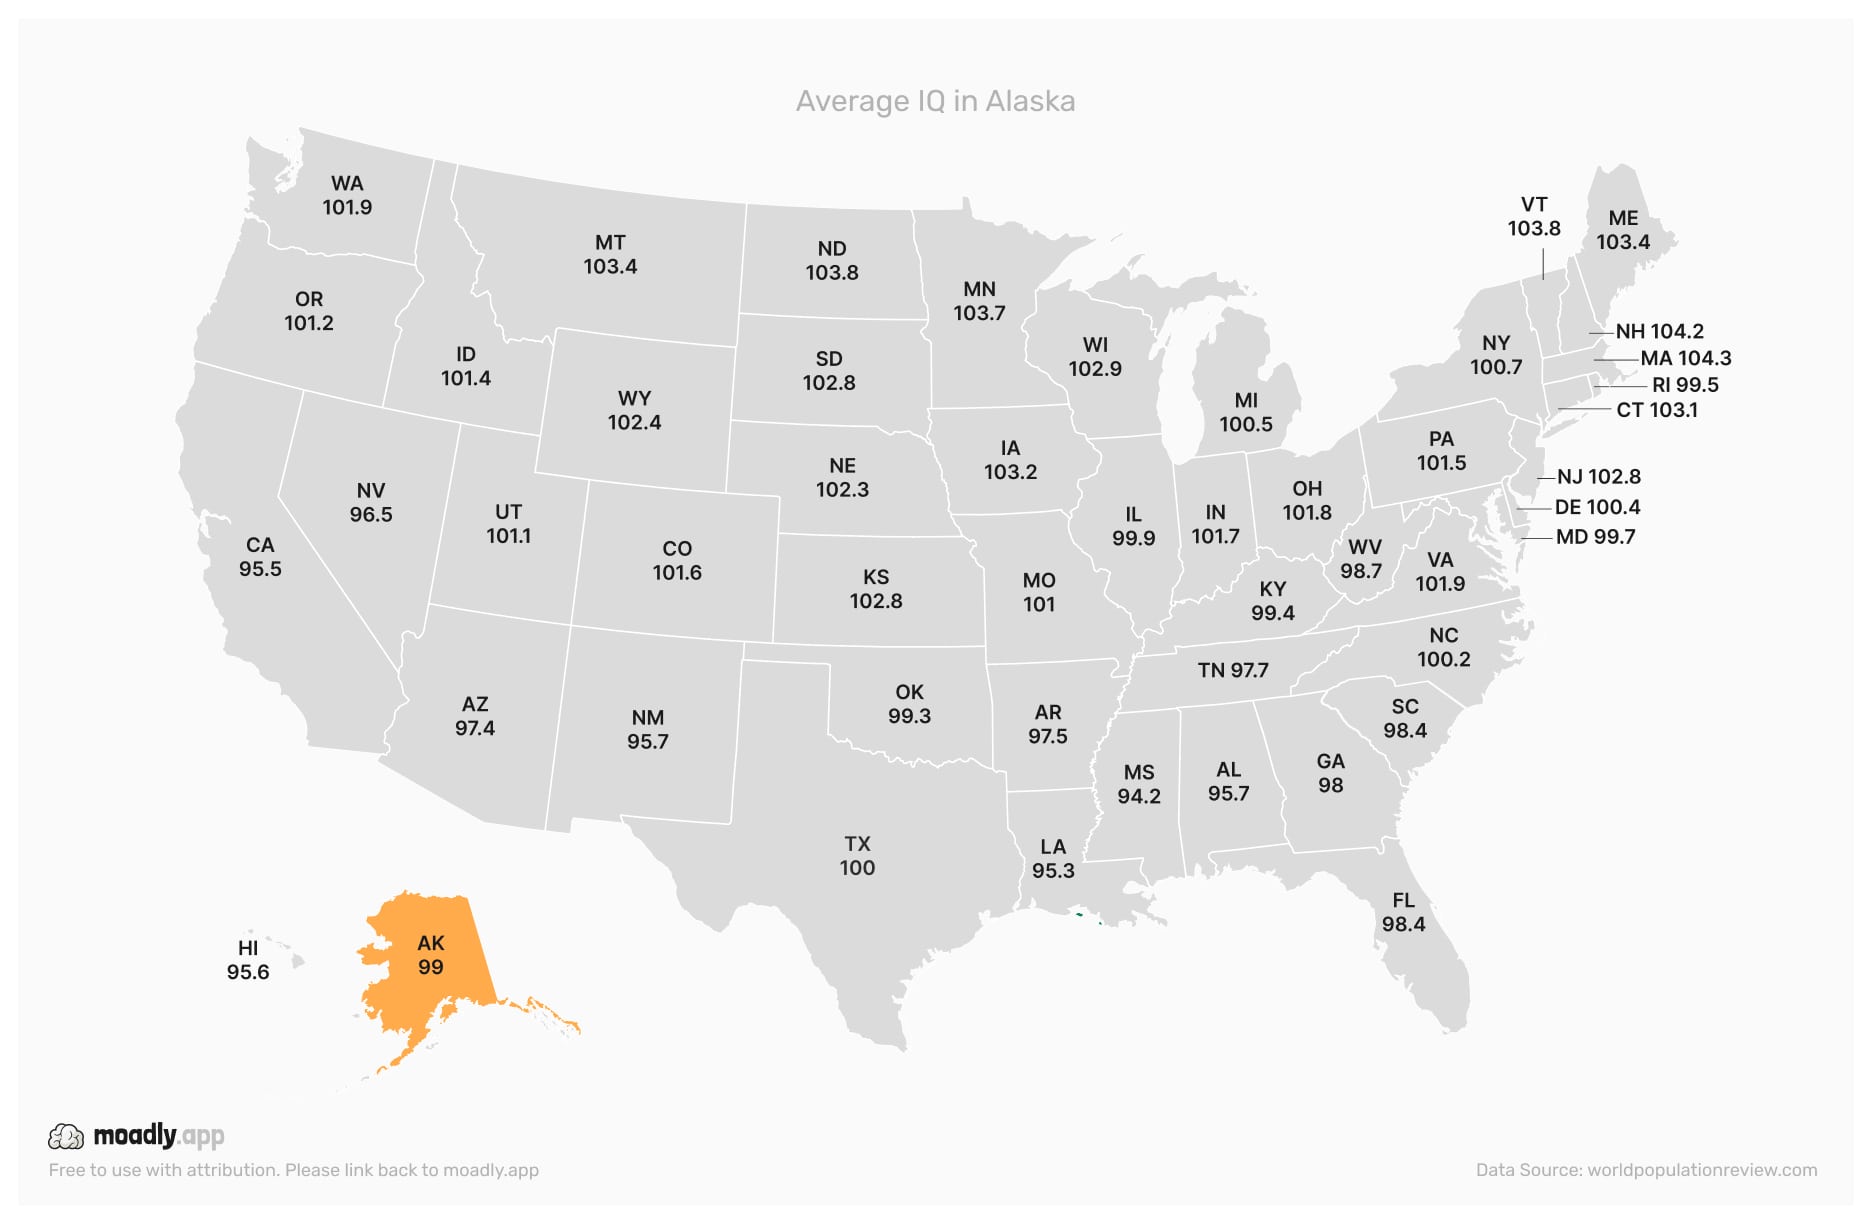
Alaska's vast geography and remote communities create unique challenges for education access, impacting statewide average IQ levels.
Average IQ in Arizona
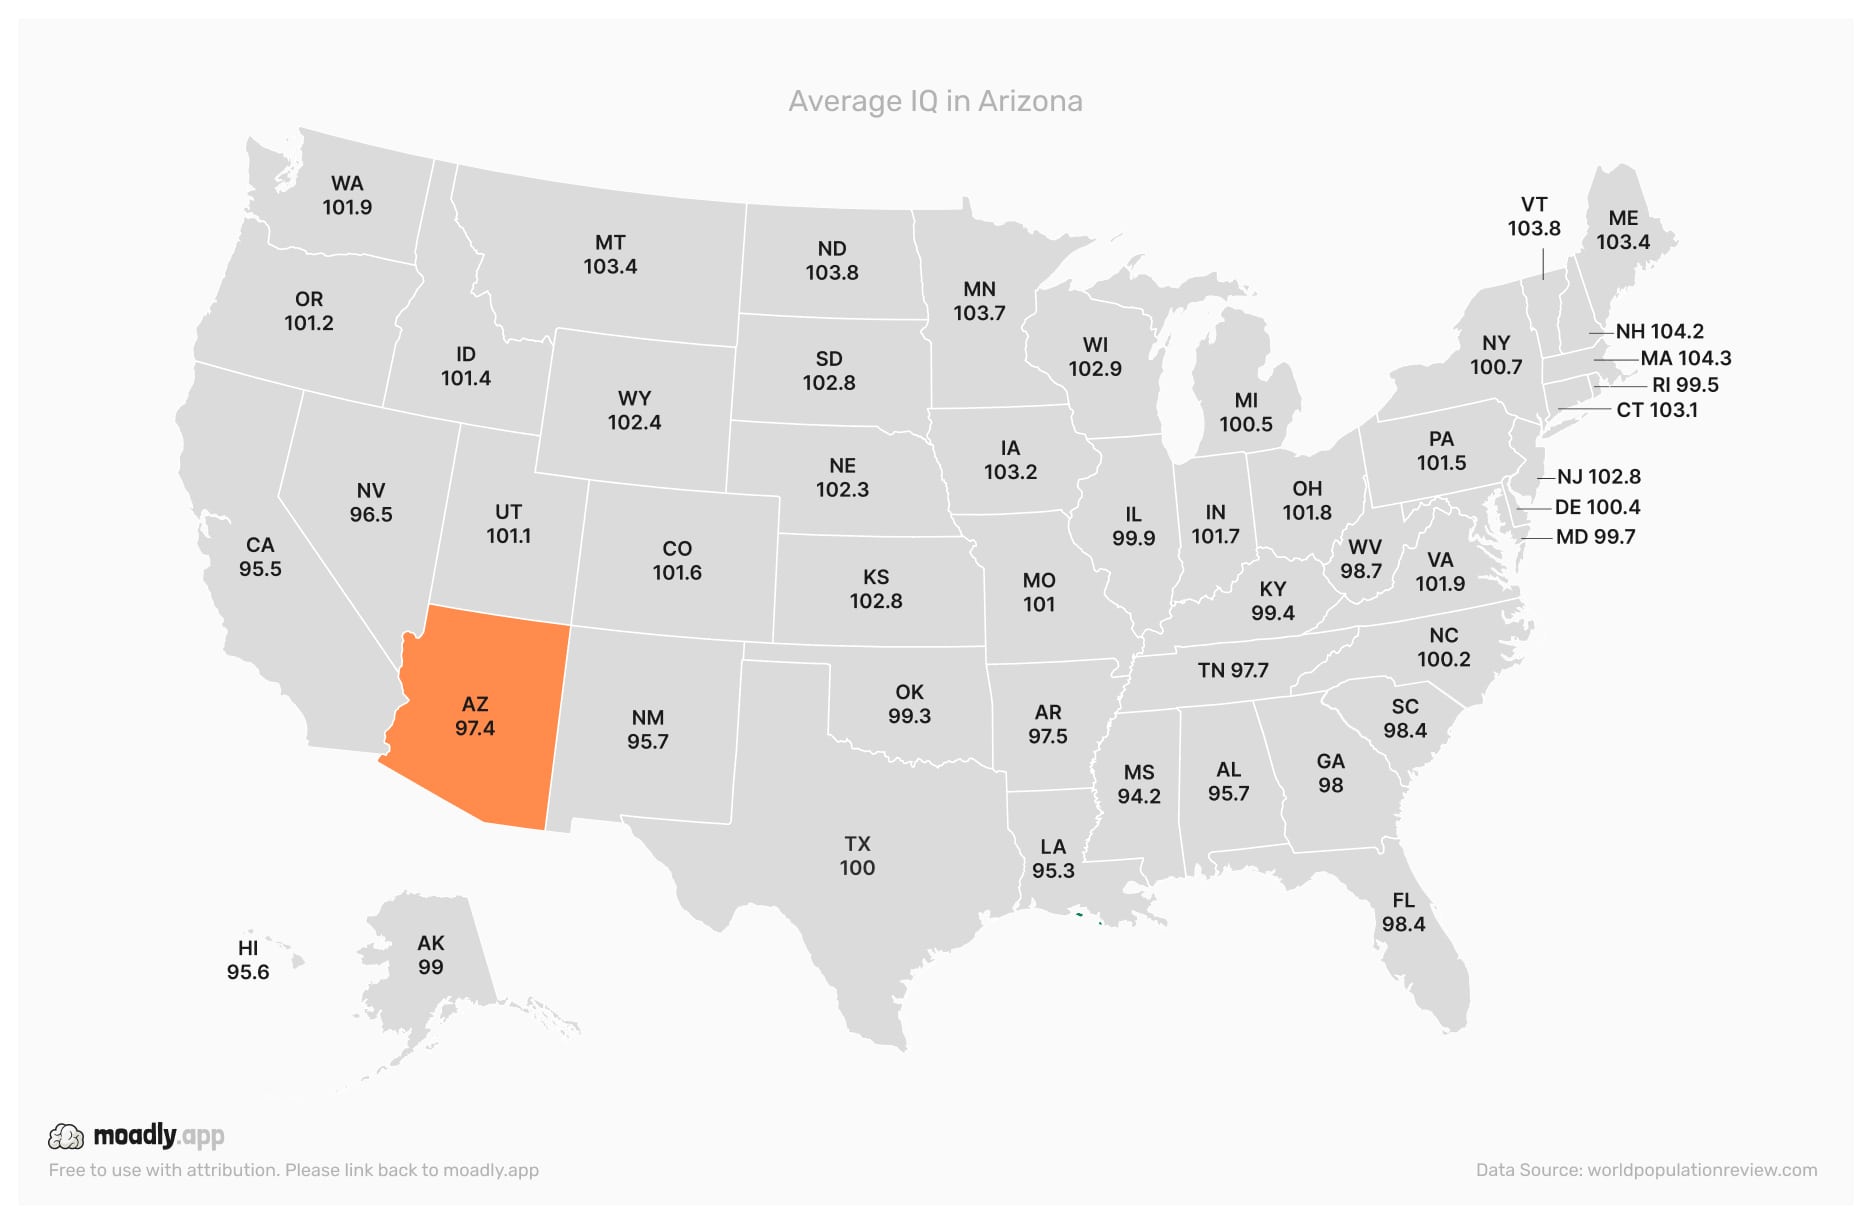
Arizona's mix of urban centers and rural regions leads to diverse educational outcomes, reflecting in its average IQ statistics.
Average IQ in Arkansas
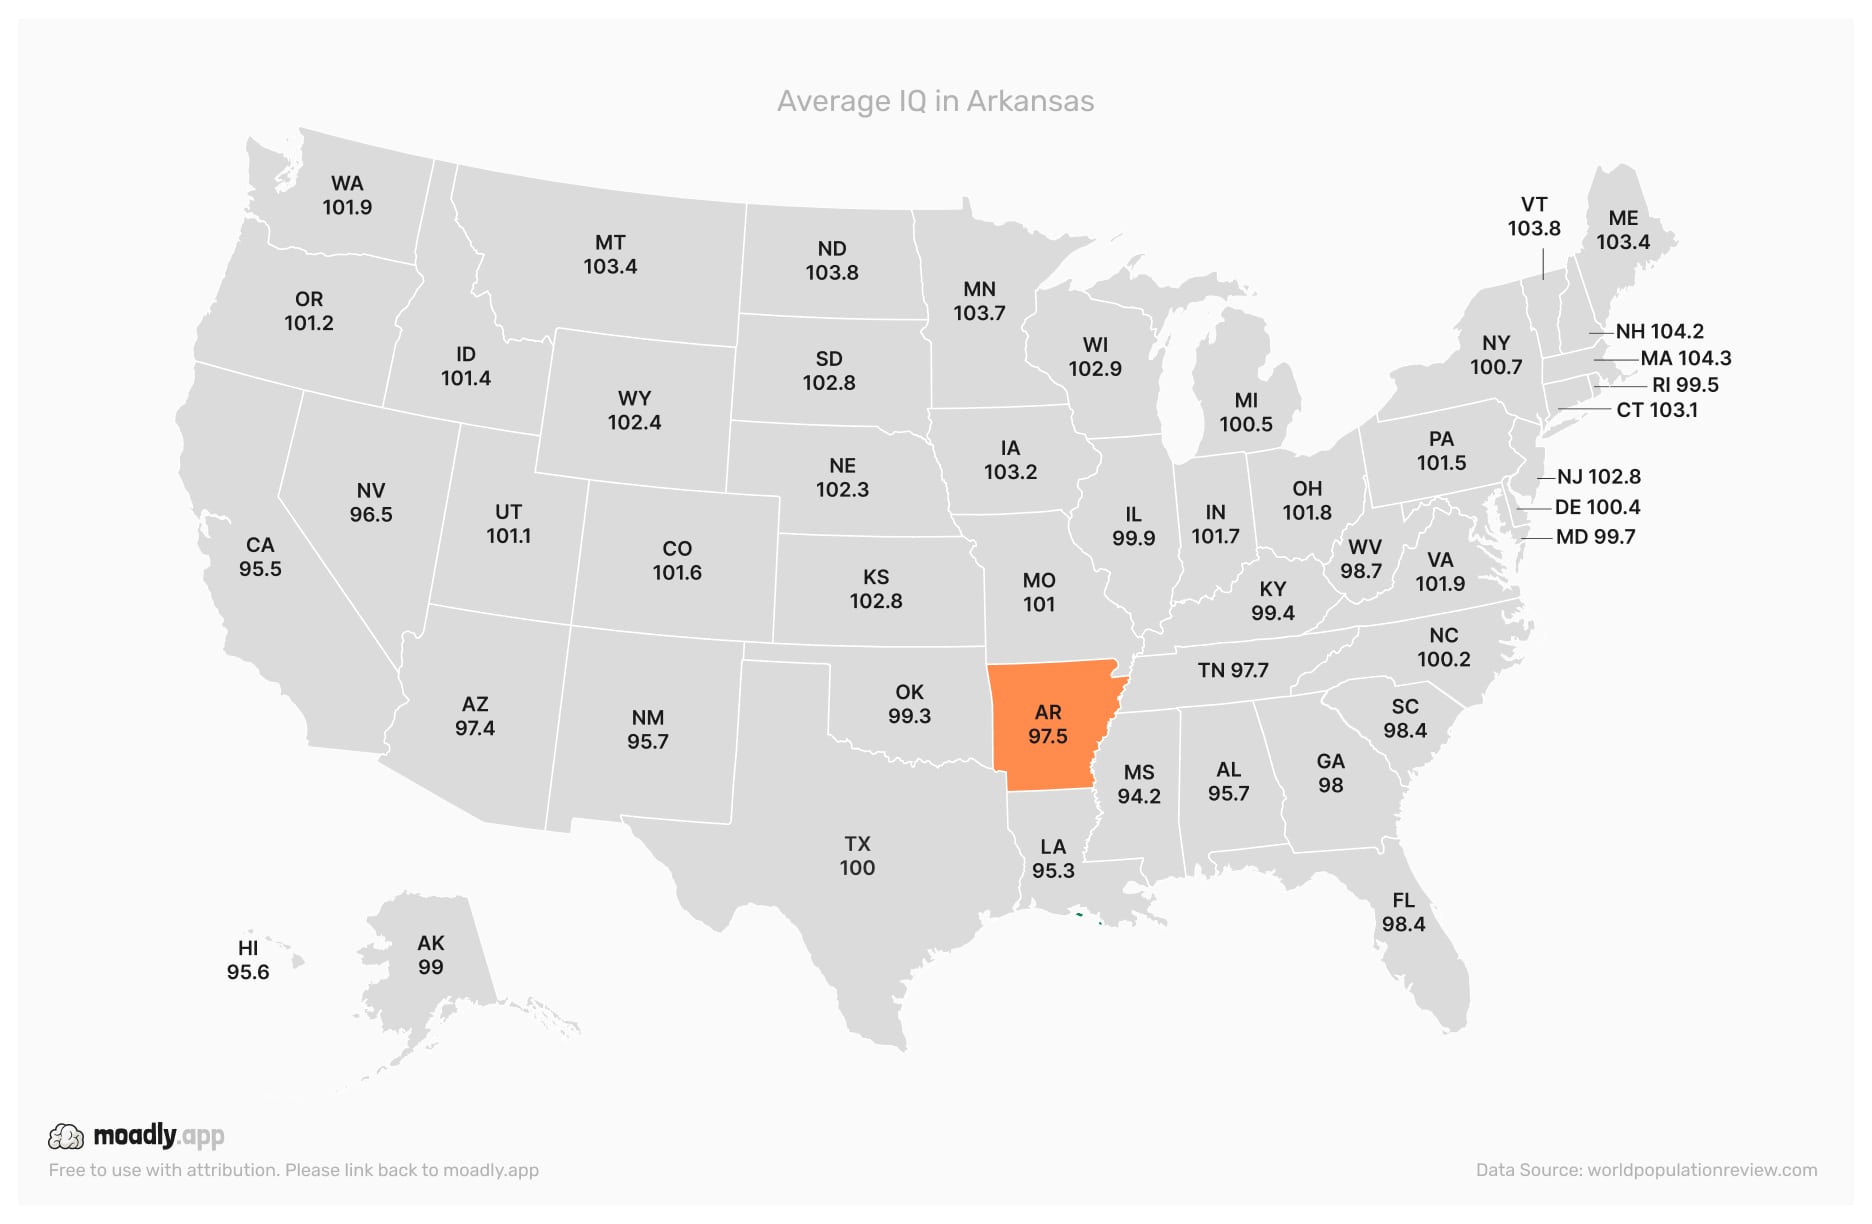
Arkansas faces rural education challenges and disparities in funding, which shape the state’s IQ performance.
Average IQ in California
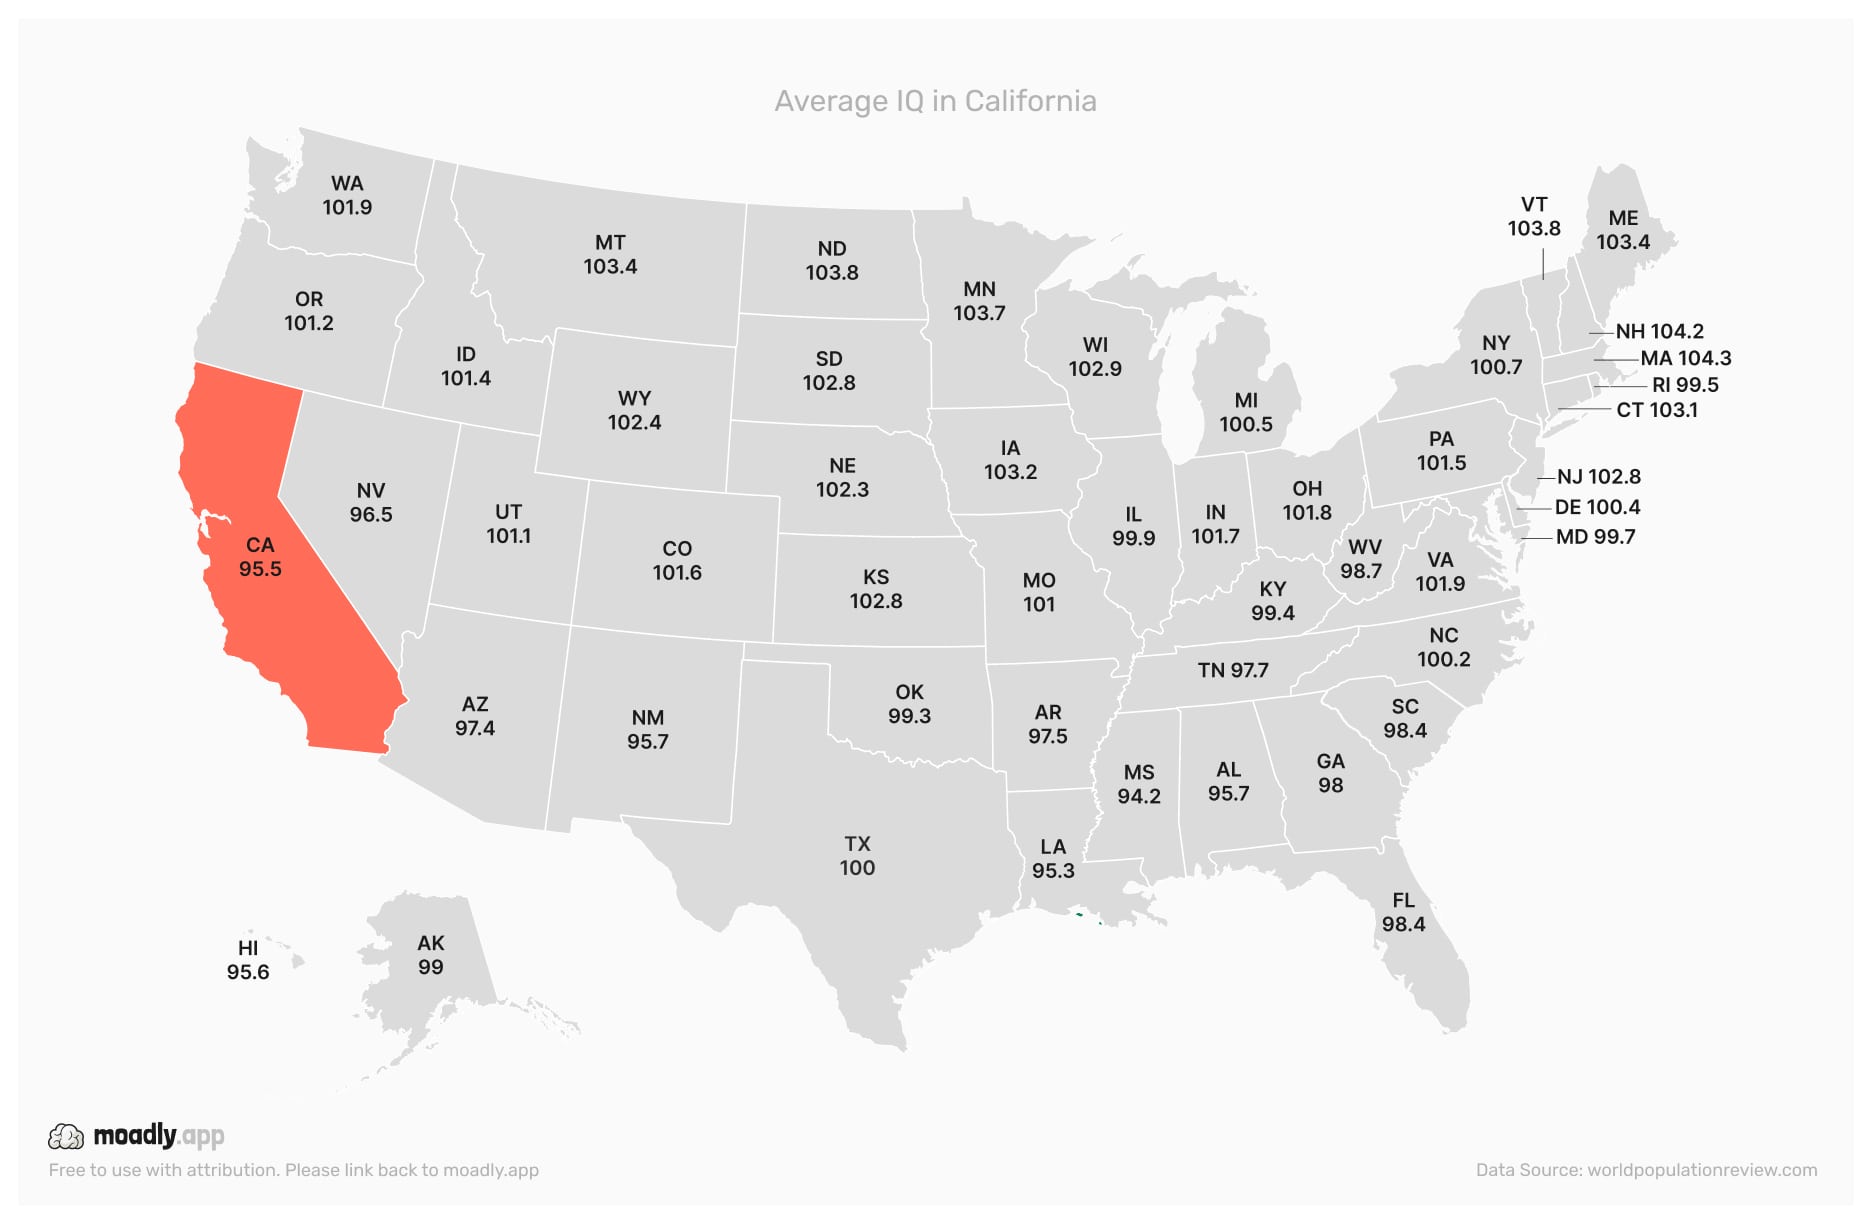
California's large, diverse population creates variation in education quality and access, affecting statewide average IQ scores.
Average IQ in Colorado
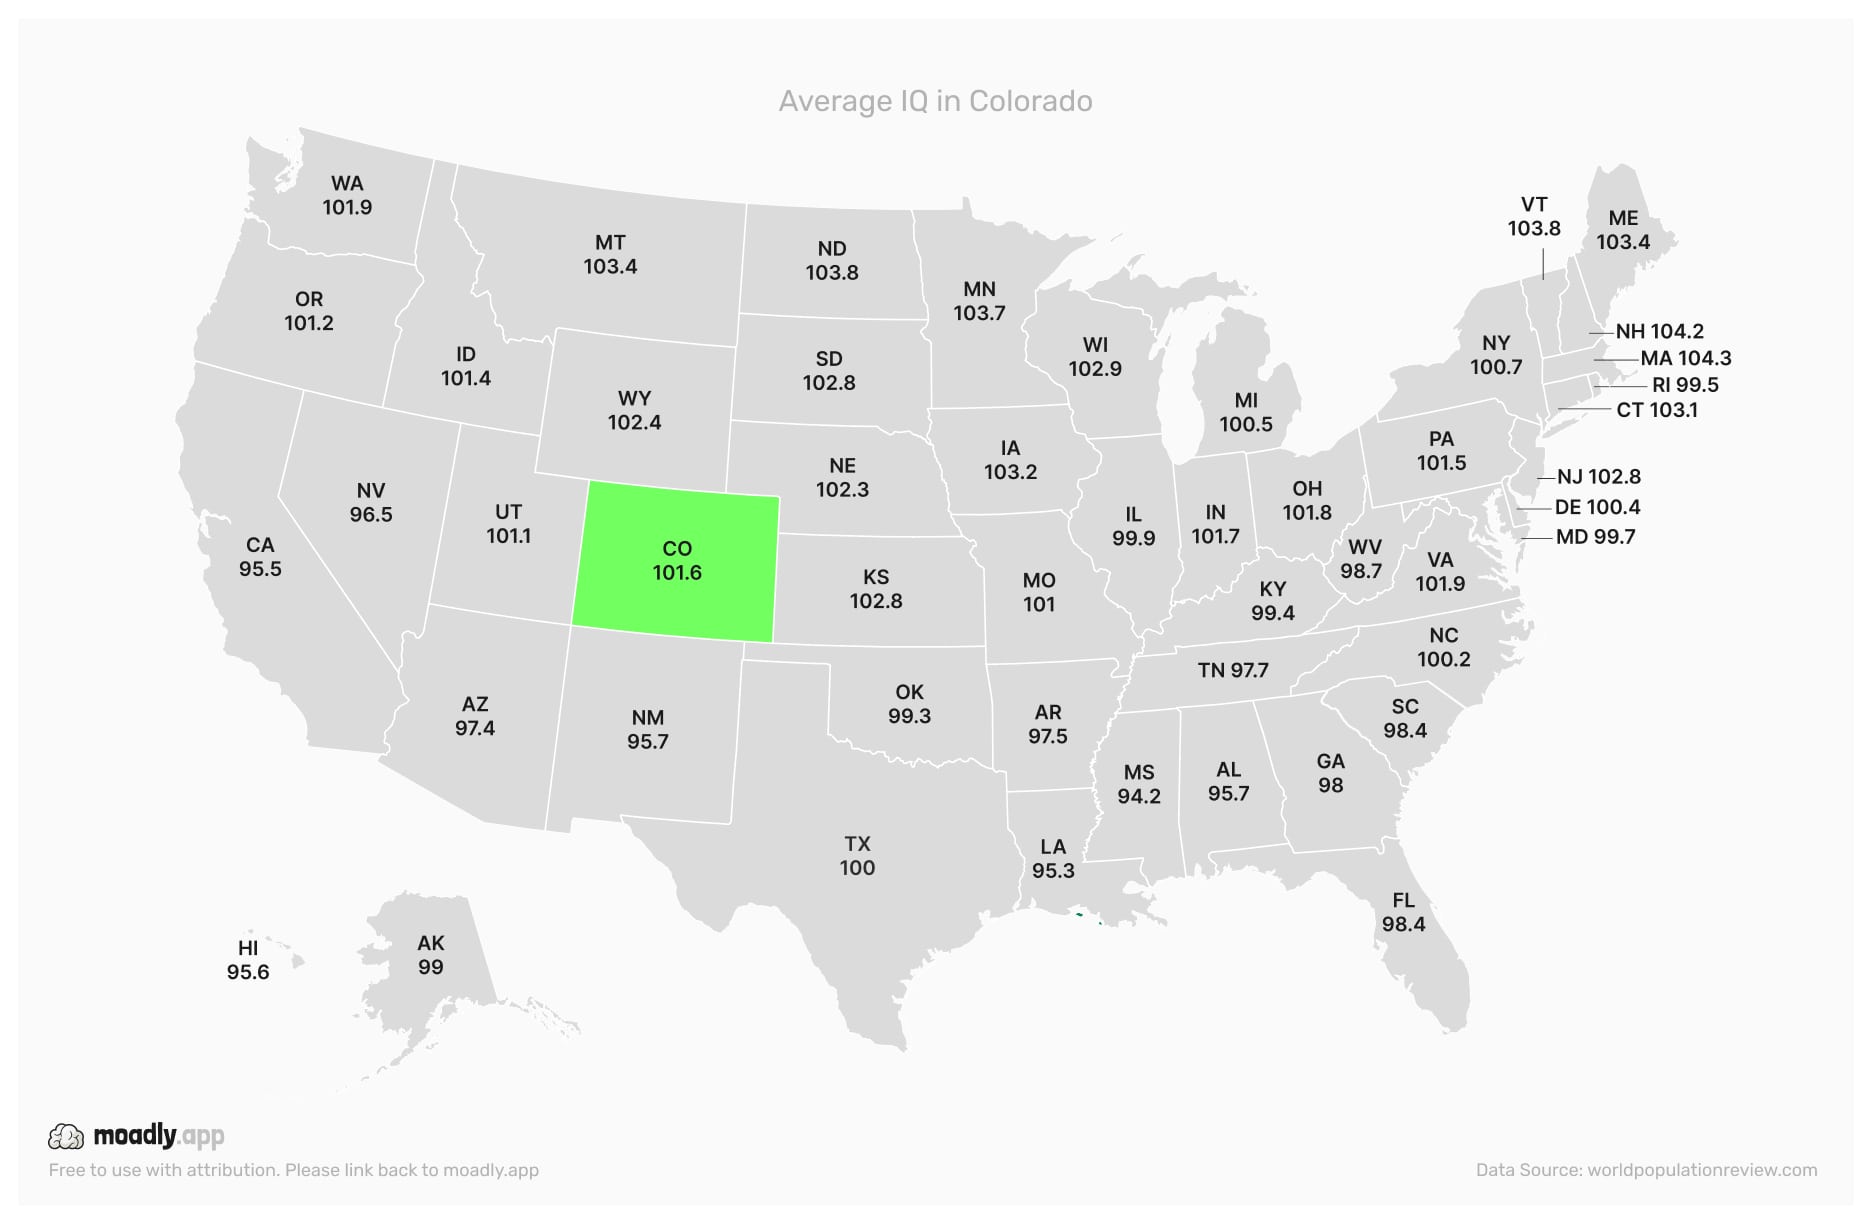
Colorado benefits from well-funded urban districts and active community programs, which help elevate average IQ outcomes.
Average IQ in Connecticut
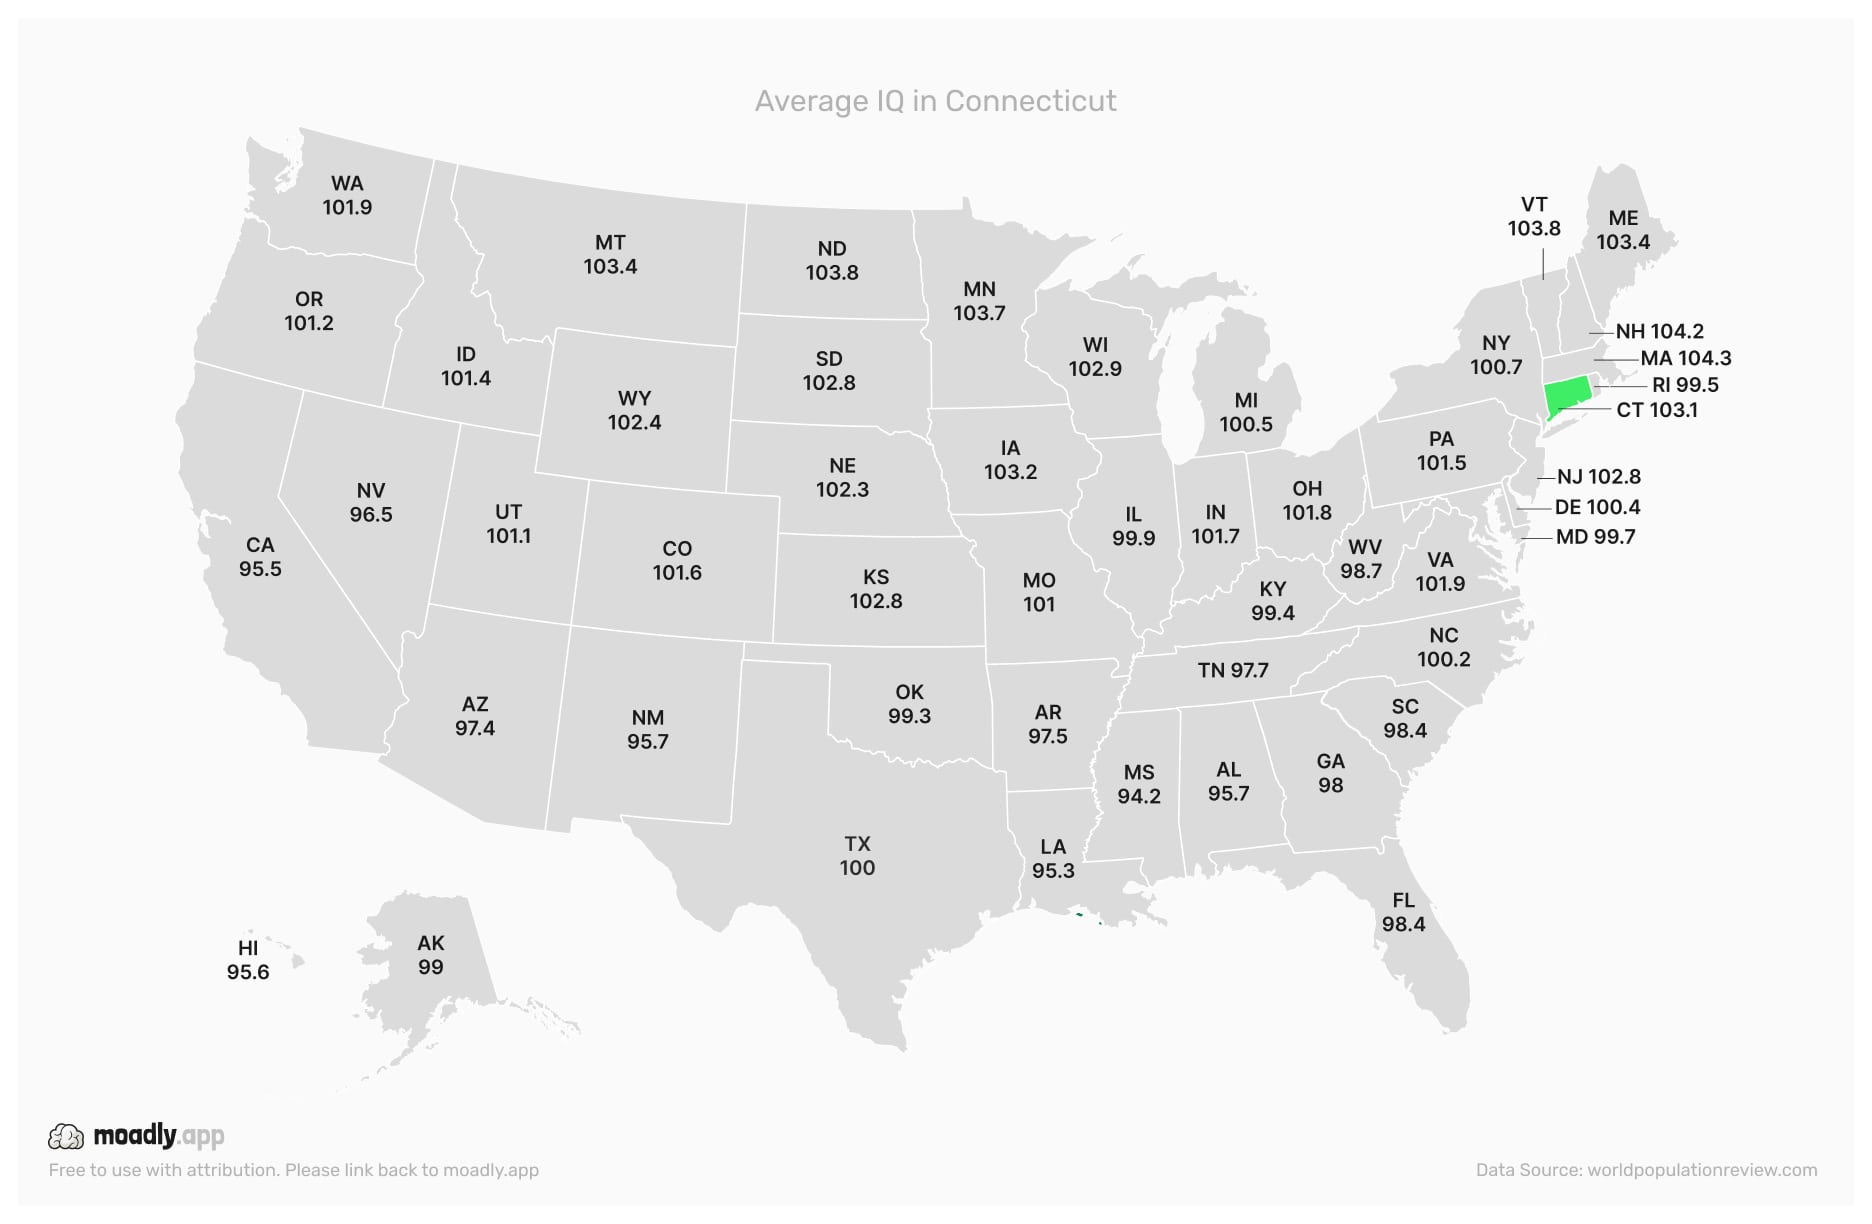
Connecticut's strong academic institutions and affluent districts contribute to higher average IQ levels statewide.
Average IQ in Delaware
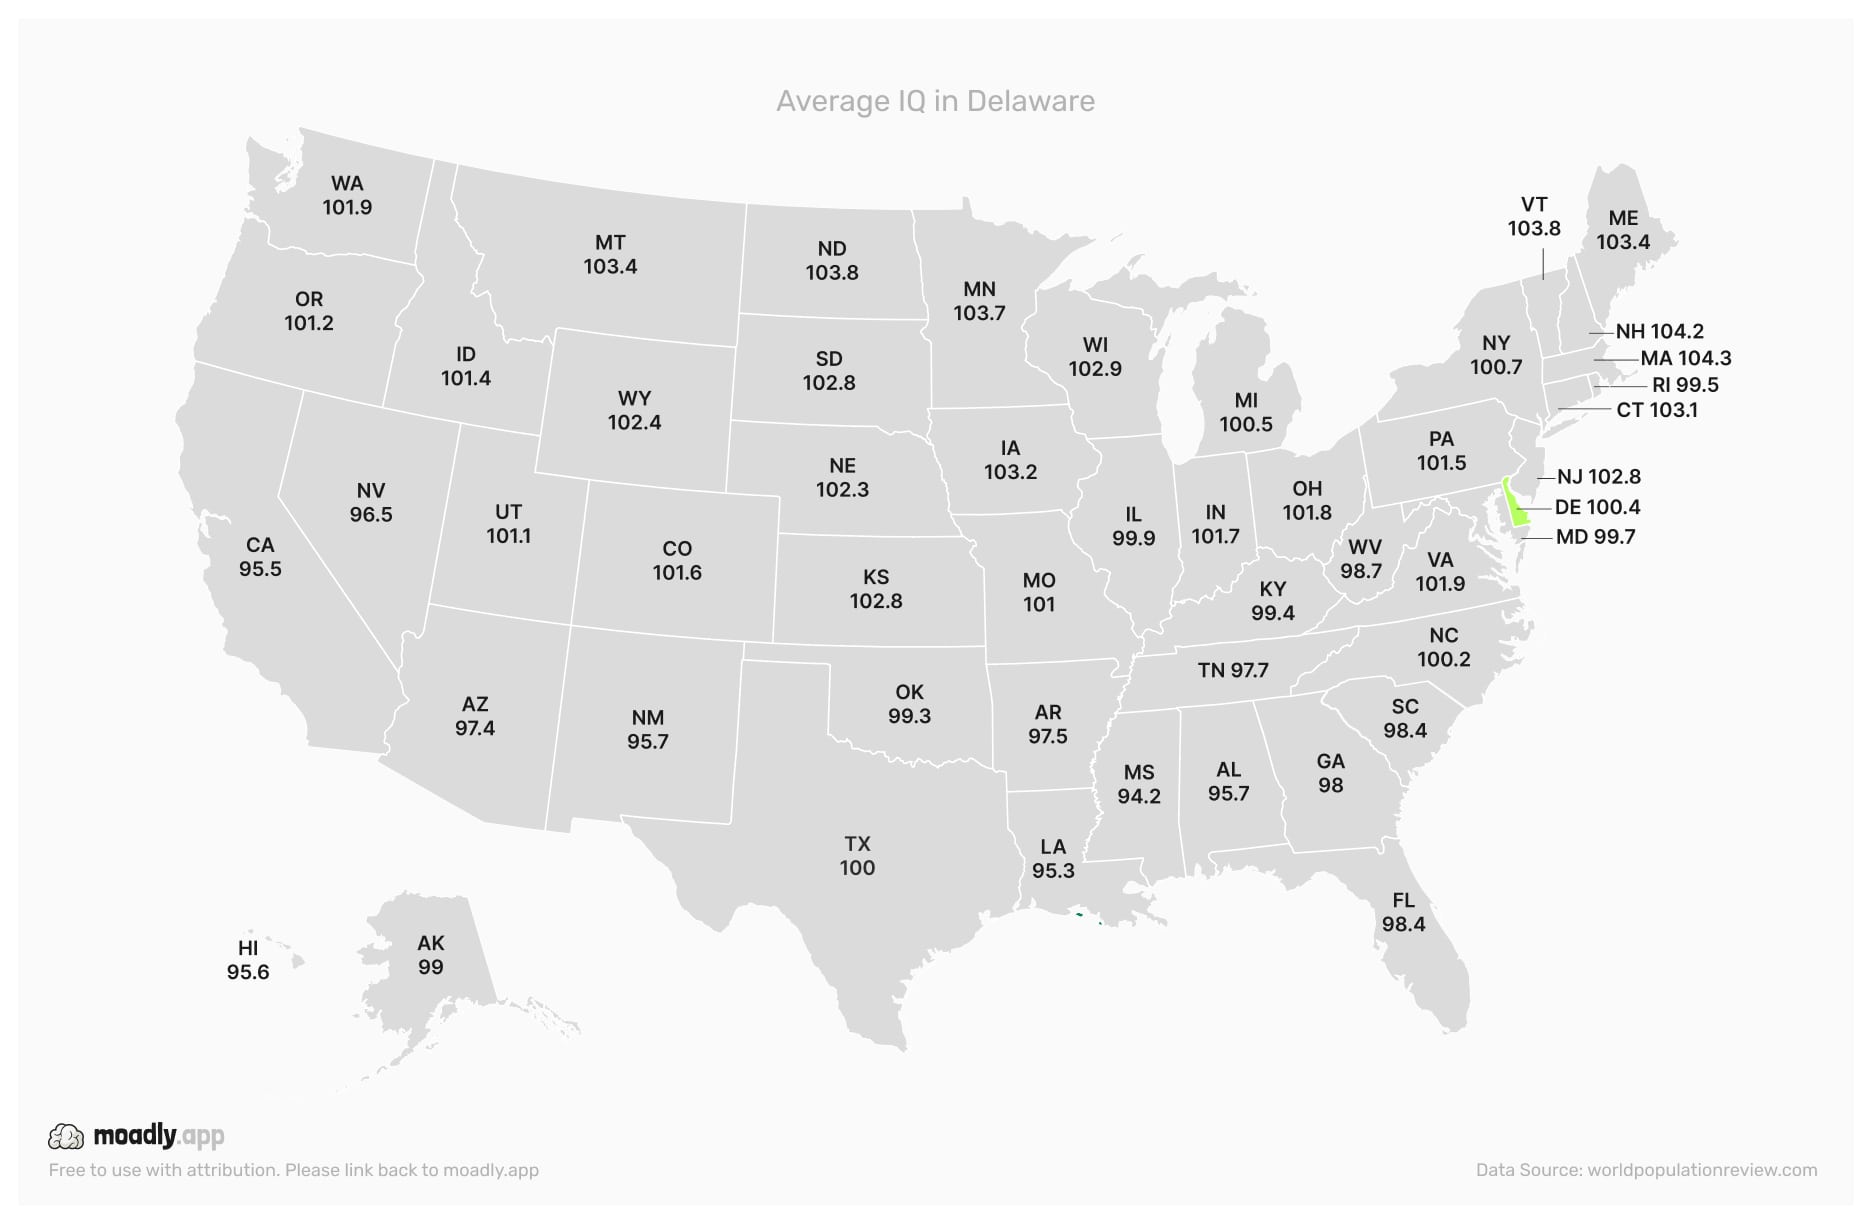
Delaware's compact geography and concentrated school districts allow targeted education policies that affect IQ outcomes.
Average IQ in Florida
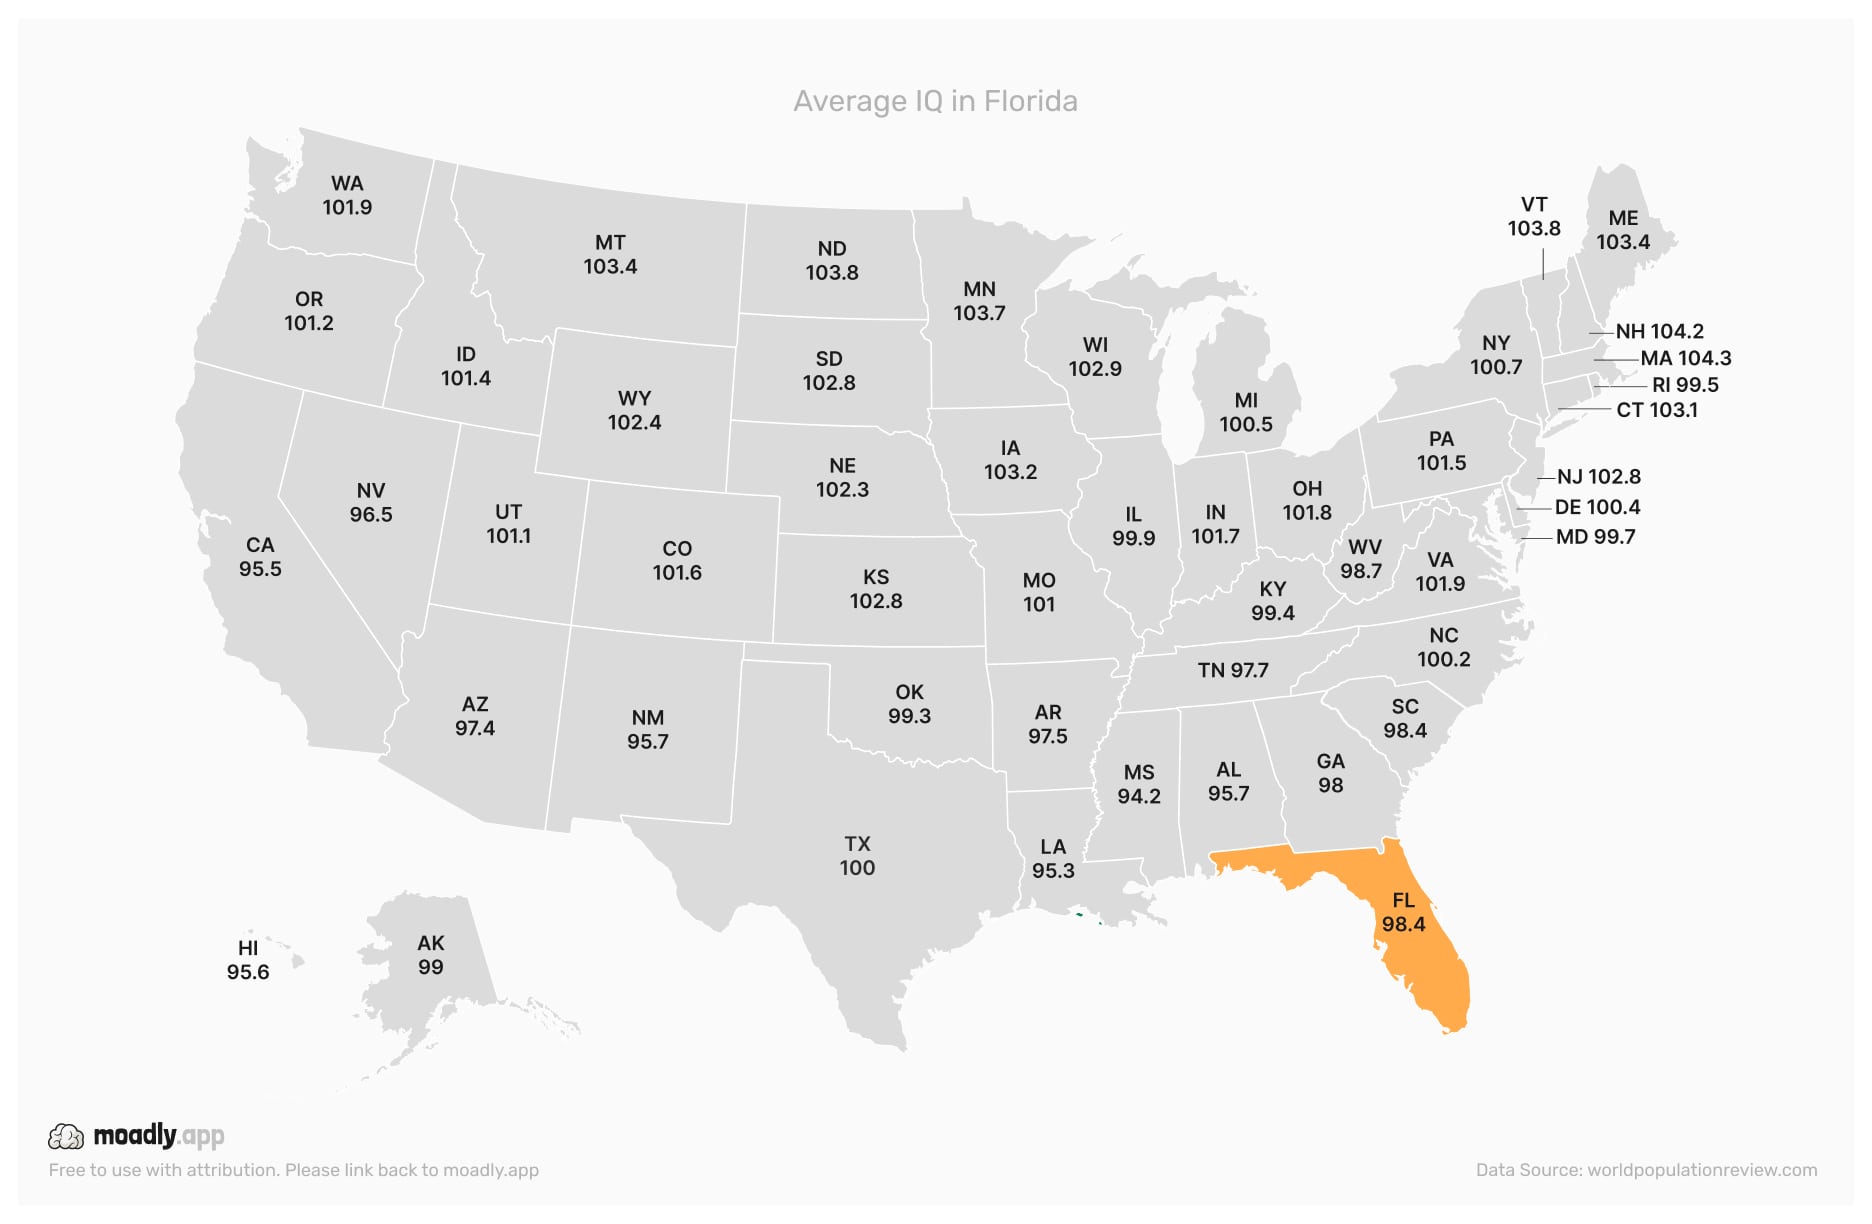
Florida's diverse population and urban growth create variation in educational attainment, influencing the state's average IQ.
Average IQ in Georgia
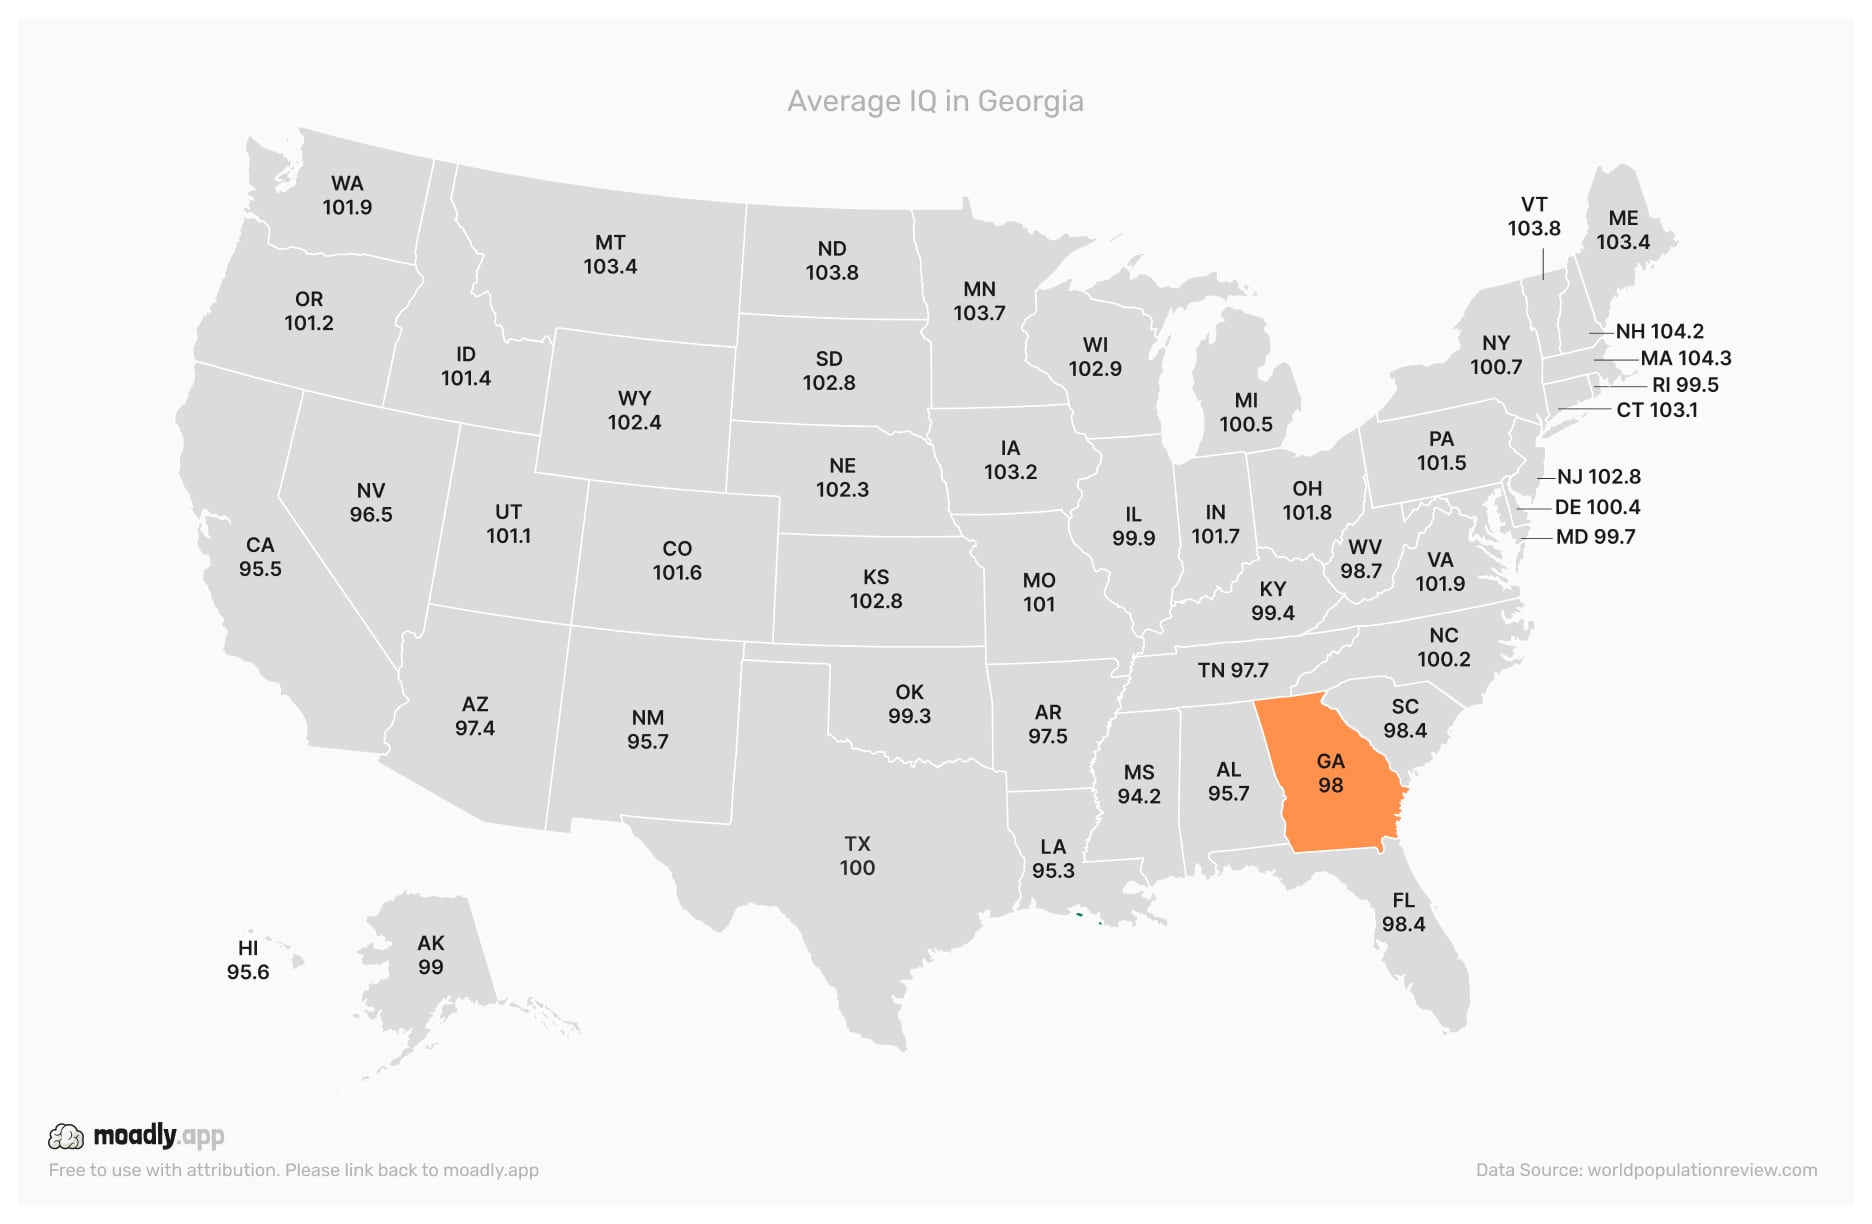
Georgia's combination of metropolitan districts and rural counties produces a mix of educational outcomes reflected in IQ data.
Average IQ in Hawaii
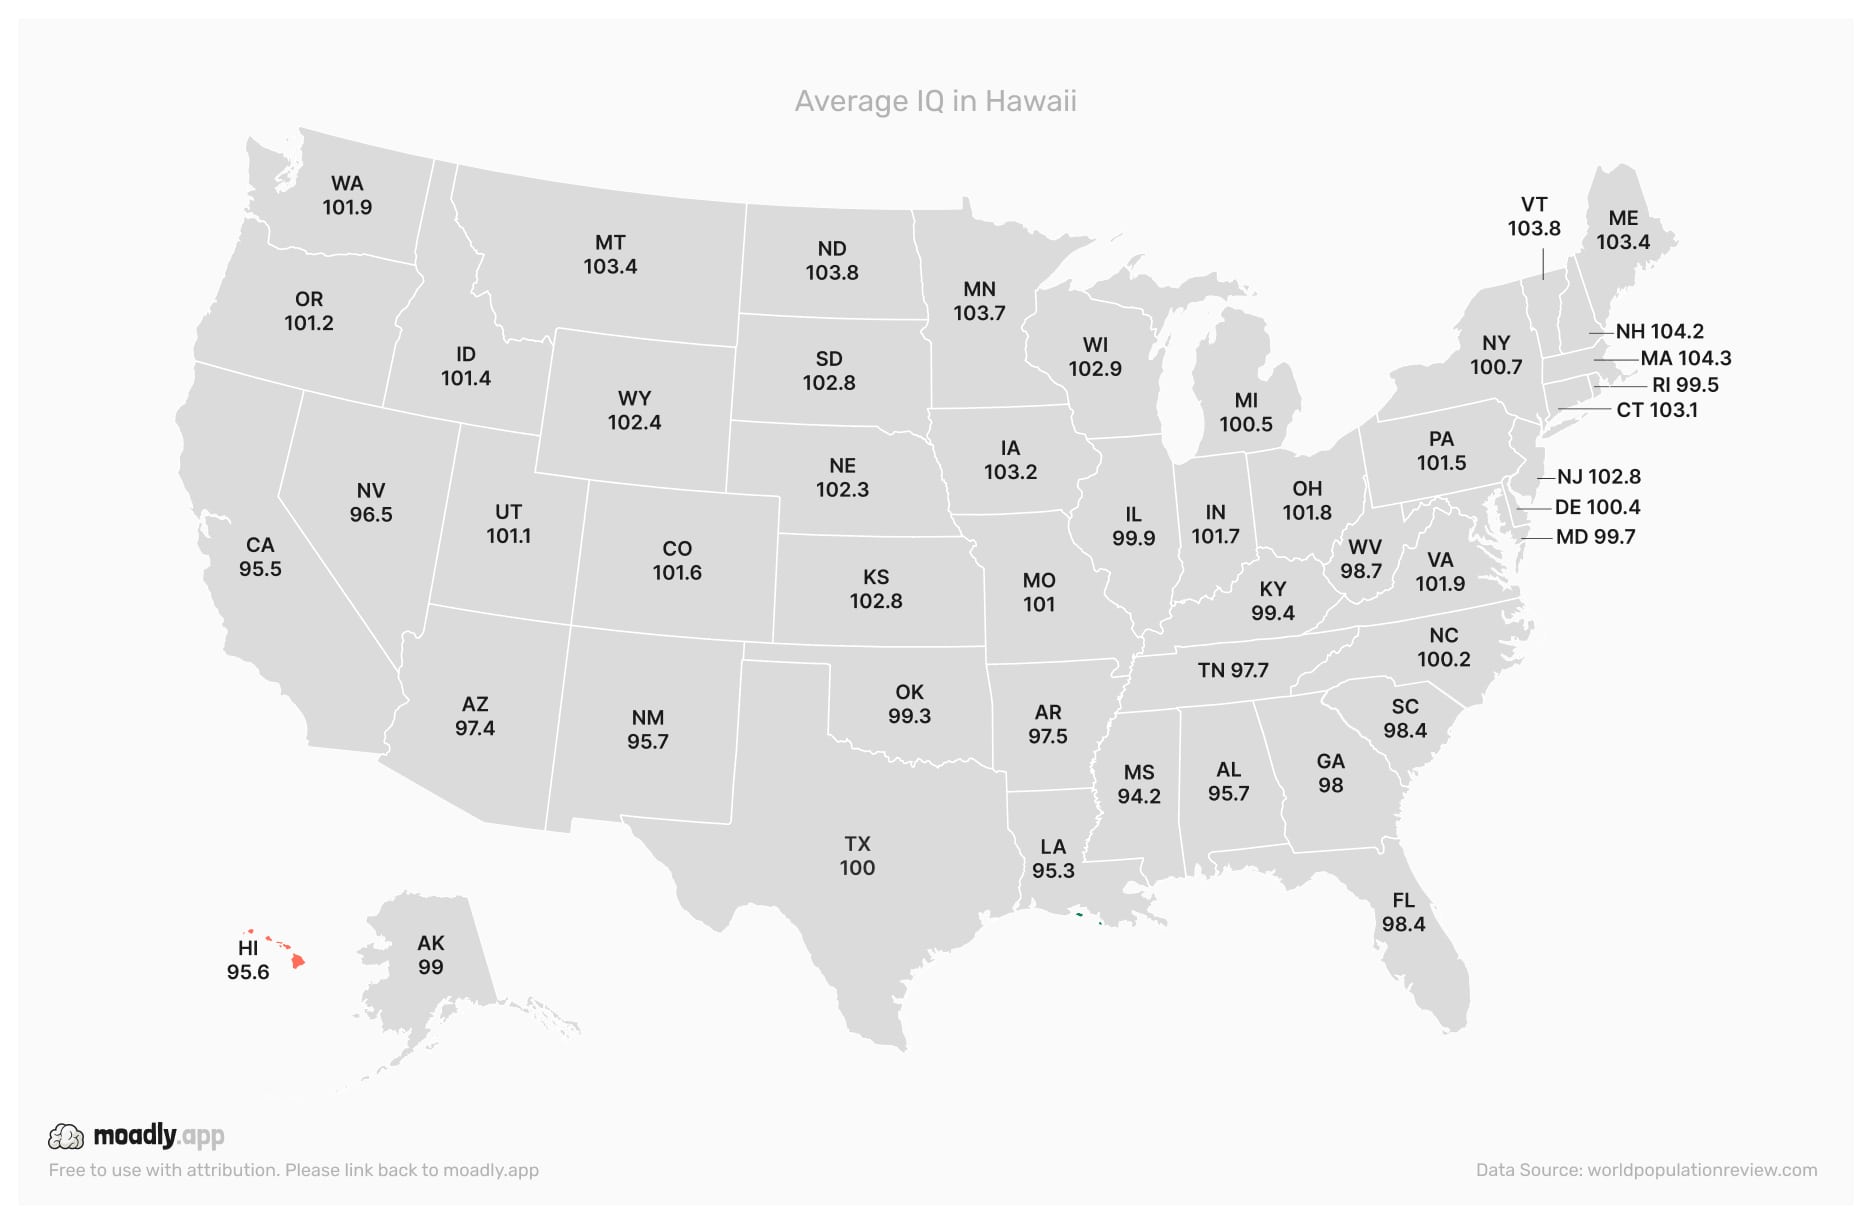
Hawaii’s island communities and cultural diversity influence access to education, shaping average IQ levels across the state.
Average IQ in Idaho
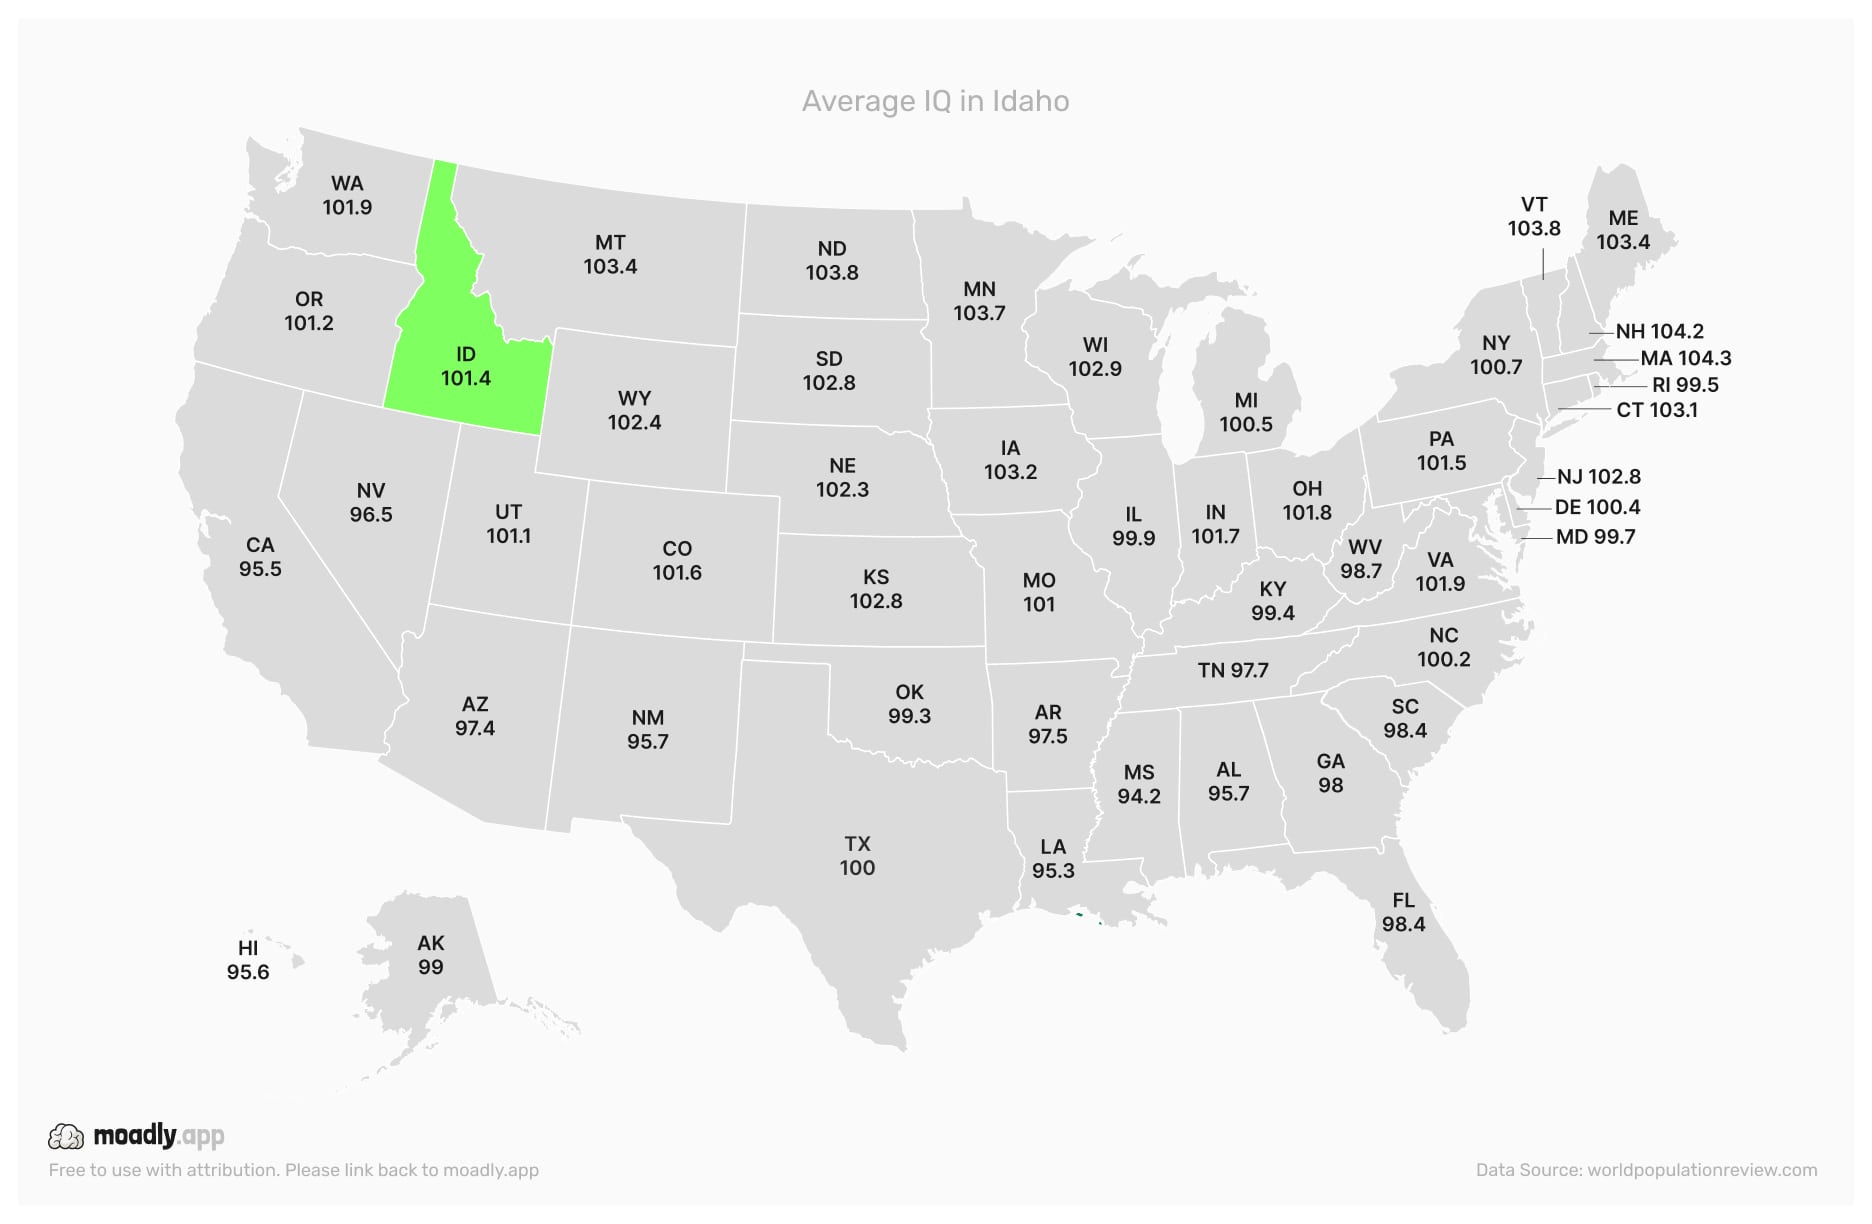
Idaho's largely rural population faces unique education challenges that contribute to statewide IQ differences.
Average IQ in Illinois
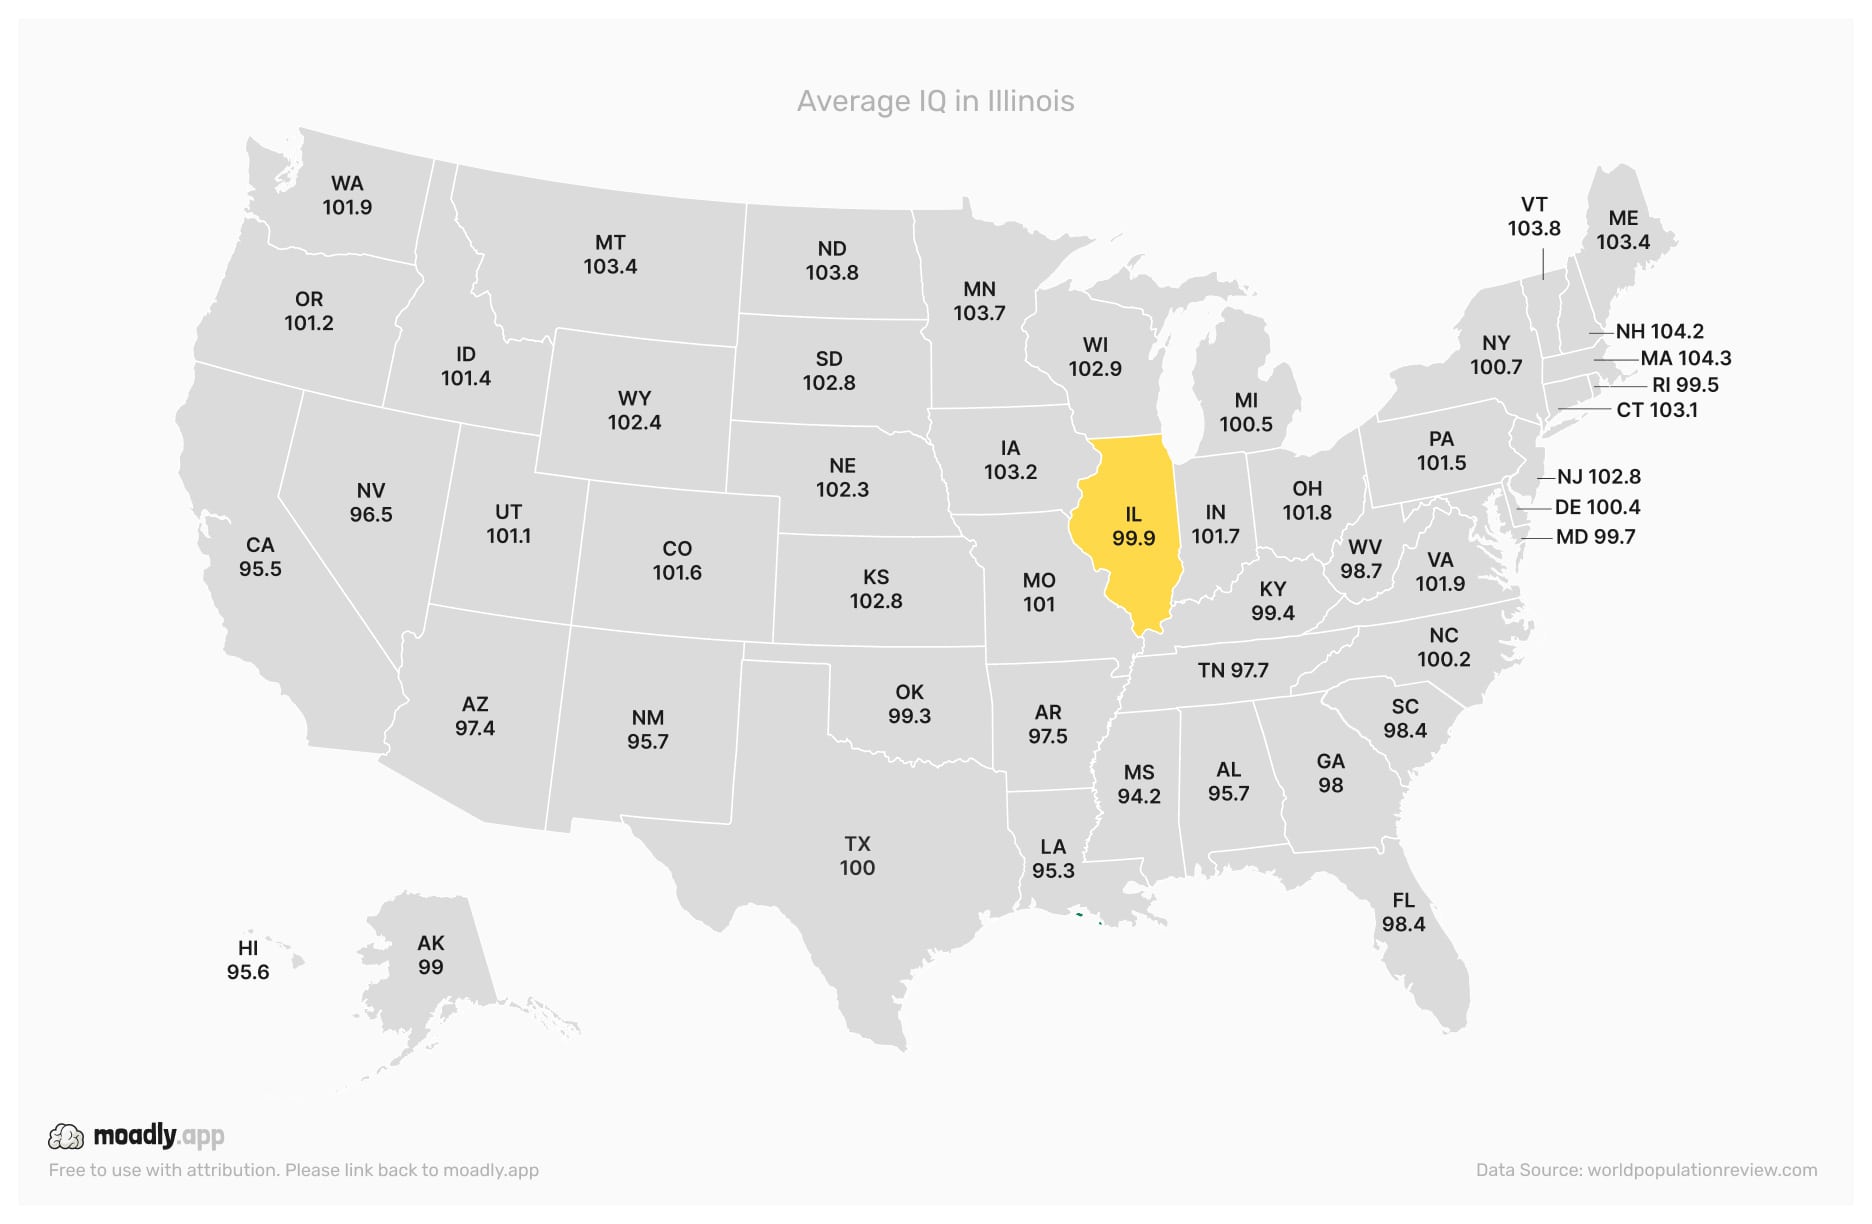
Illinois has strong urban school districts but also underfunded rural areas, creating a wide range of educational outcomes and IQ levels.
Average IQ in Indiana

Indiana’s mix of industrial cities and agricultural regions affects education access, influencing statewide average IQ.
Average IQ in Iowa
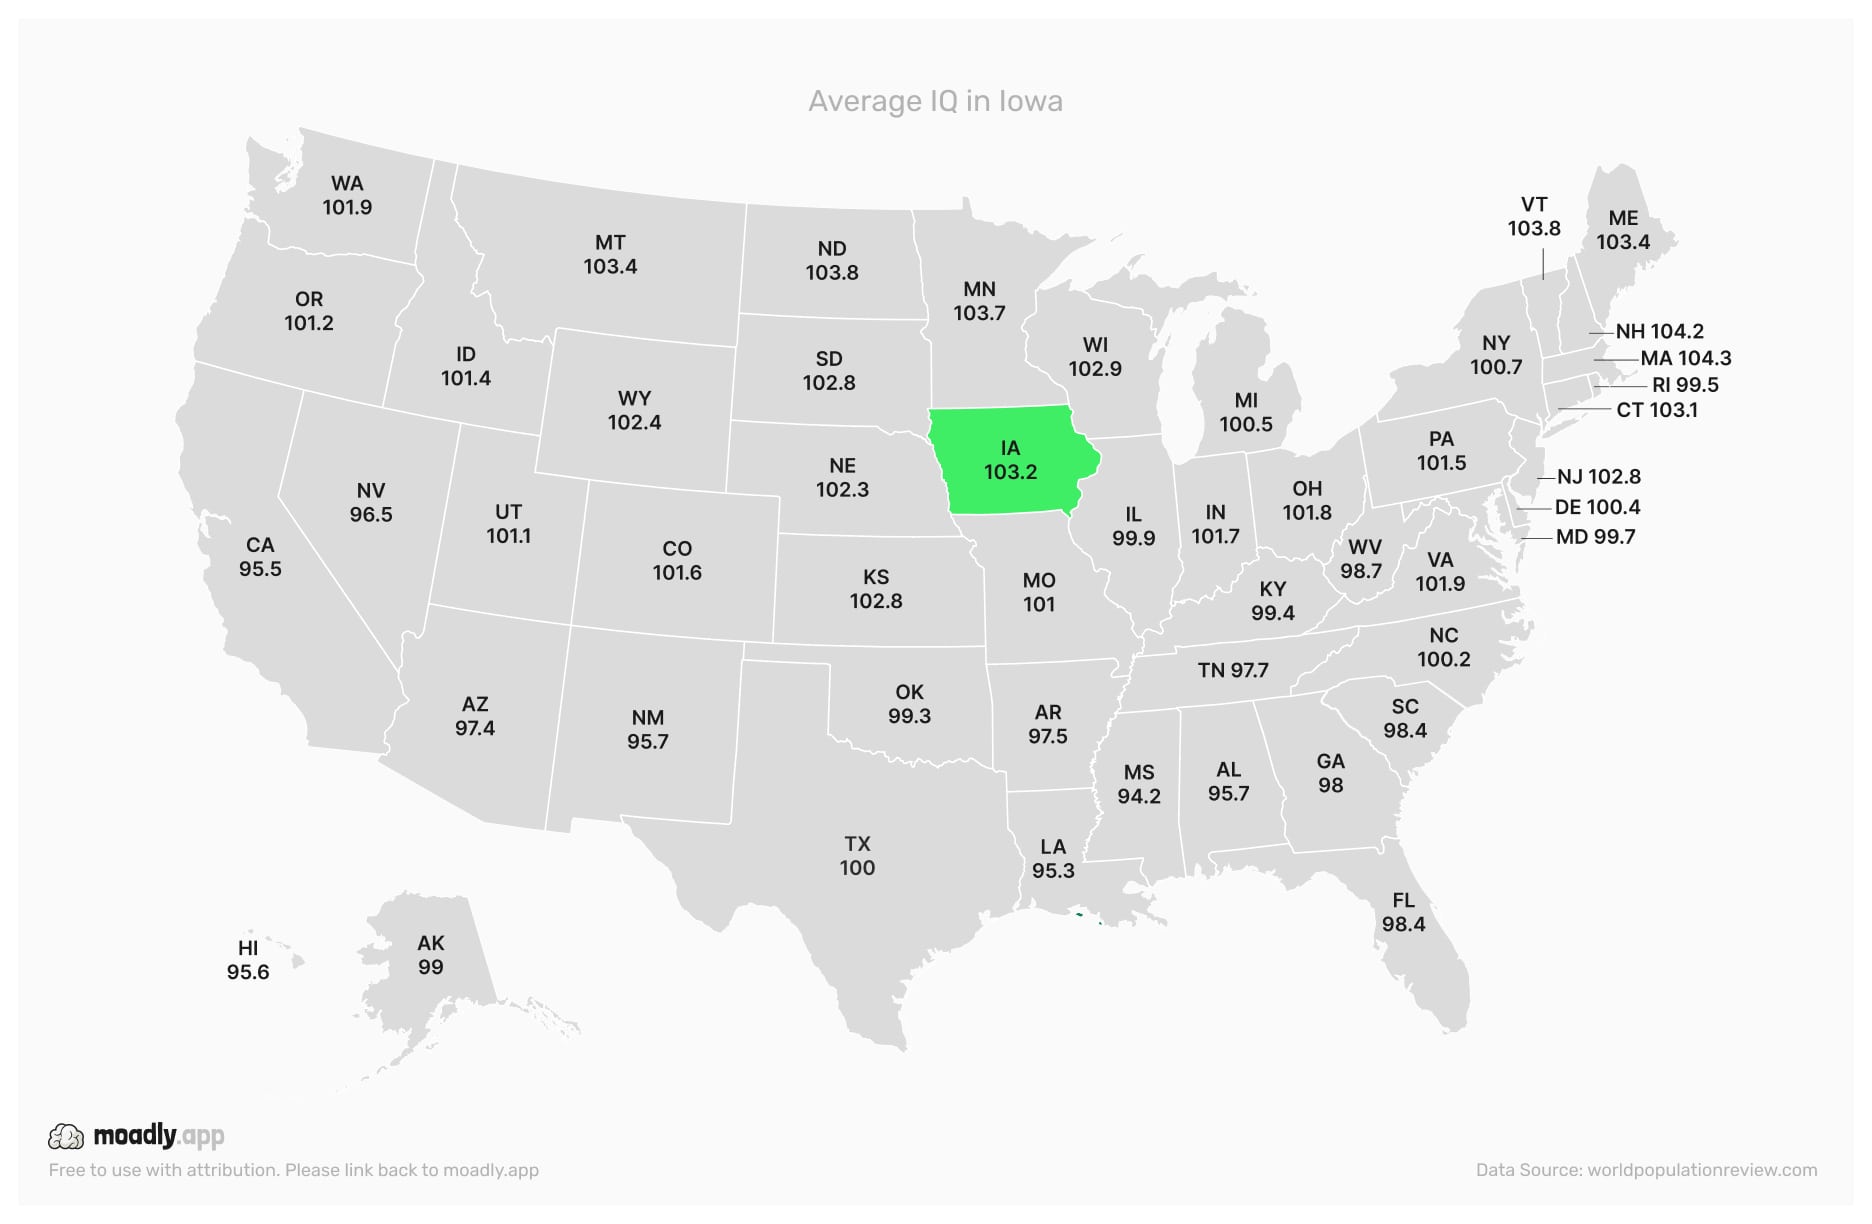
Iowa's strong public school system and focus on education in both urban and rural areas help maintain consistent IQ outcomes.
Average IQ in Kansas
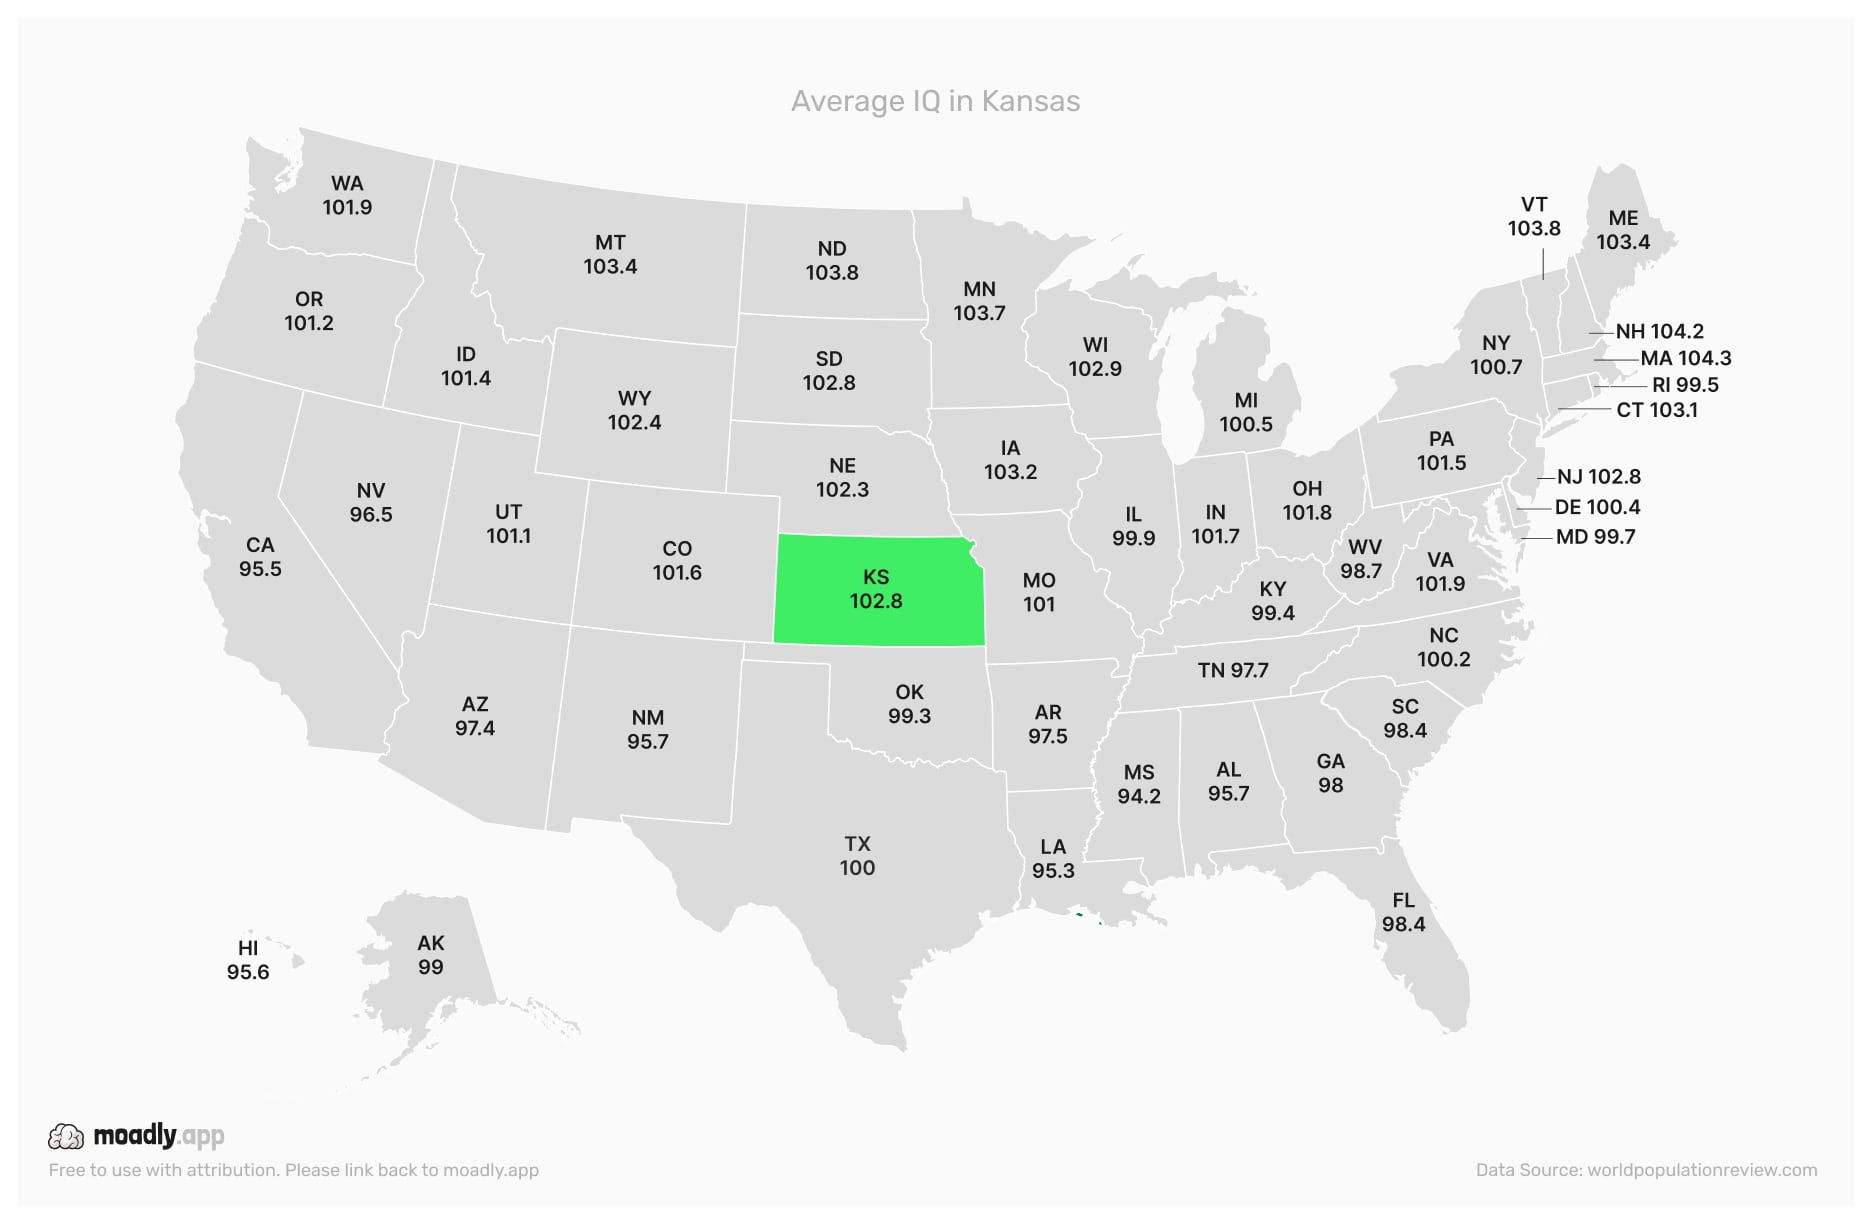
Kansas’ agricultural communities and urban centers create a mix of educational access and achievement that reflects in IQ scores.
Average IQ in Kentucky

Kentucky’s rural school districts face funding challenges, while urban centers provide more resources, resulting in varied IQ outcomes.
Average IQ in Louisiana
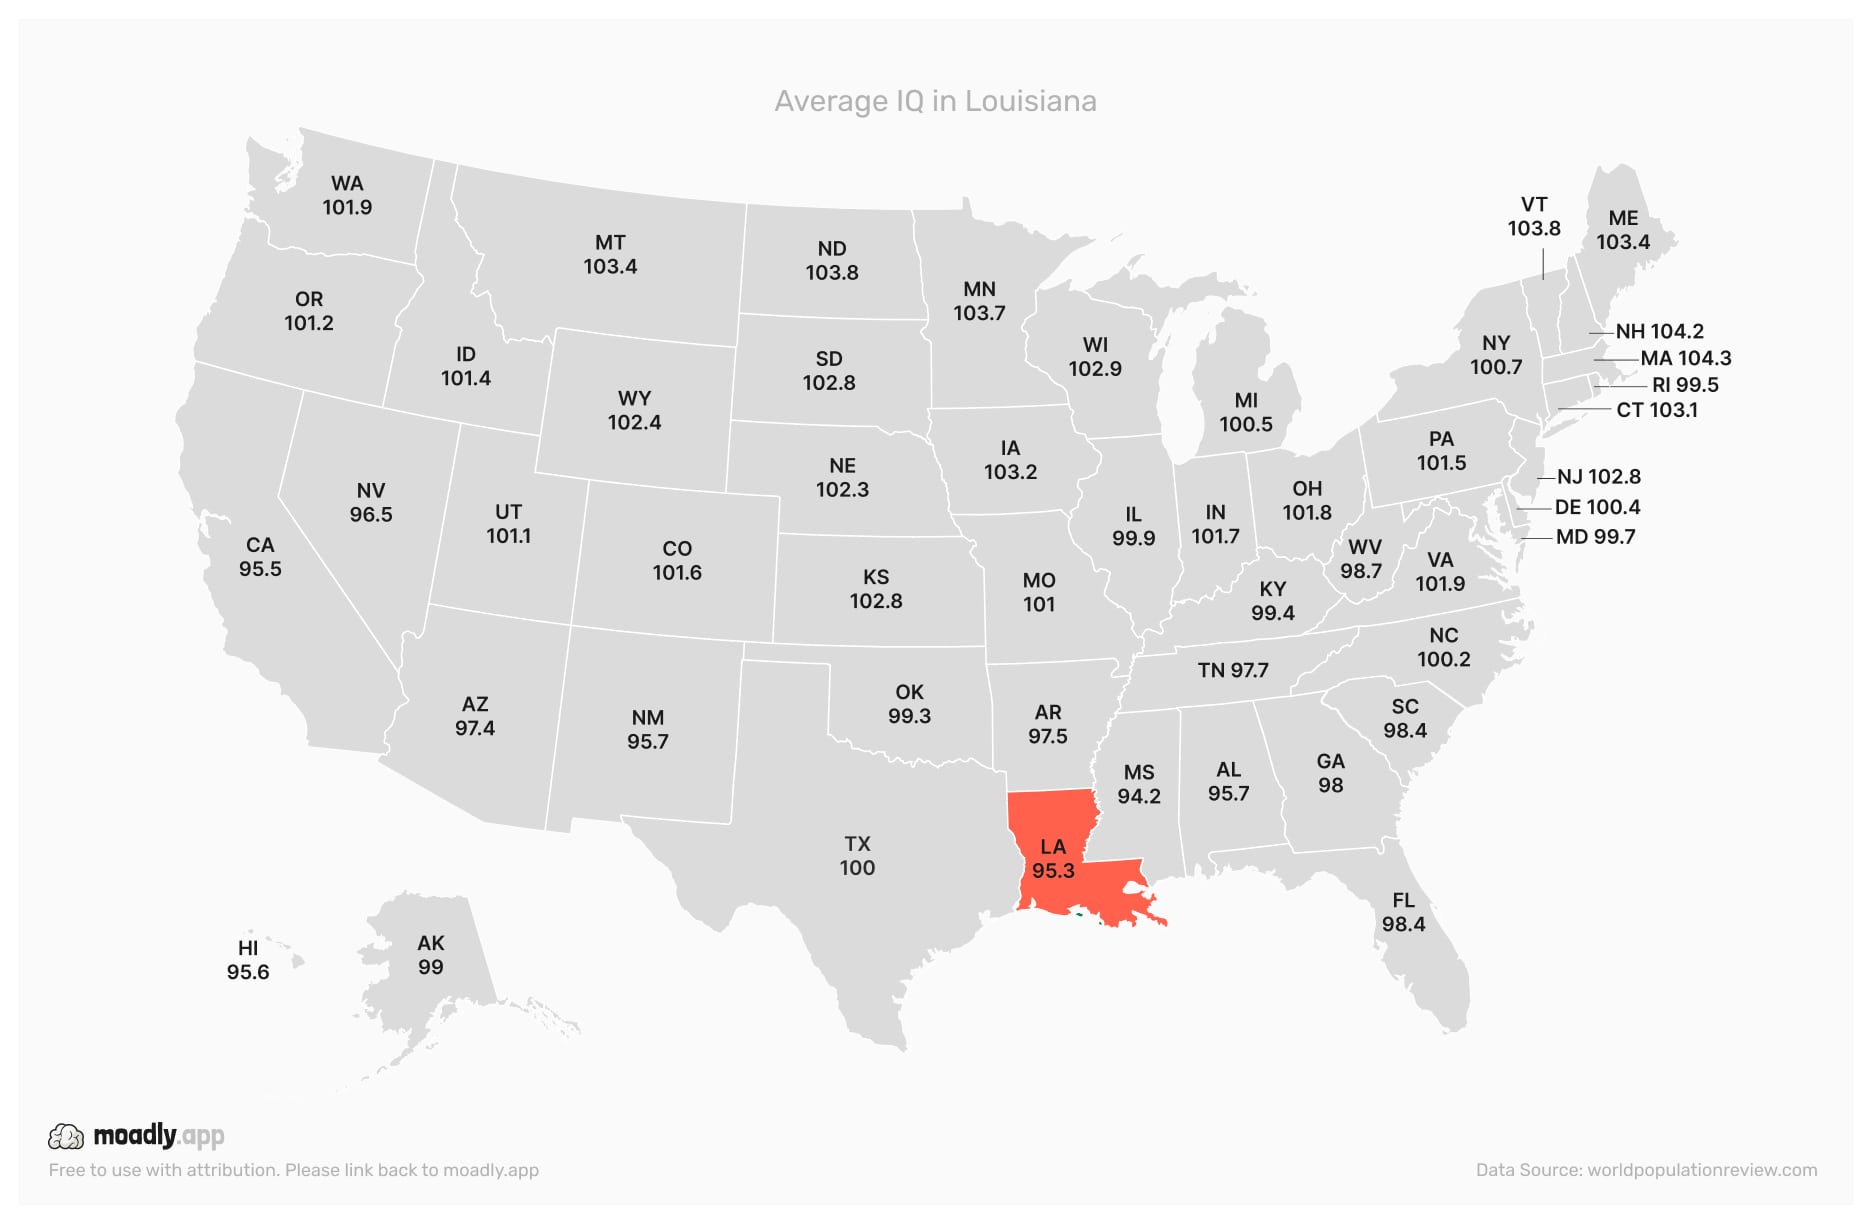
Louisiana's educational system is affected by regional disparities and urban-rural divides, impacting average IQ levels.
Average IQ in Maine
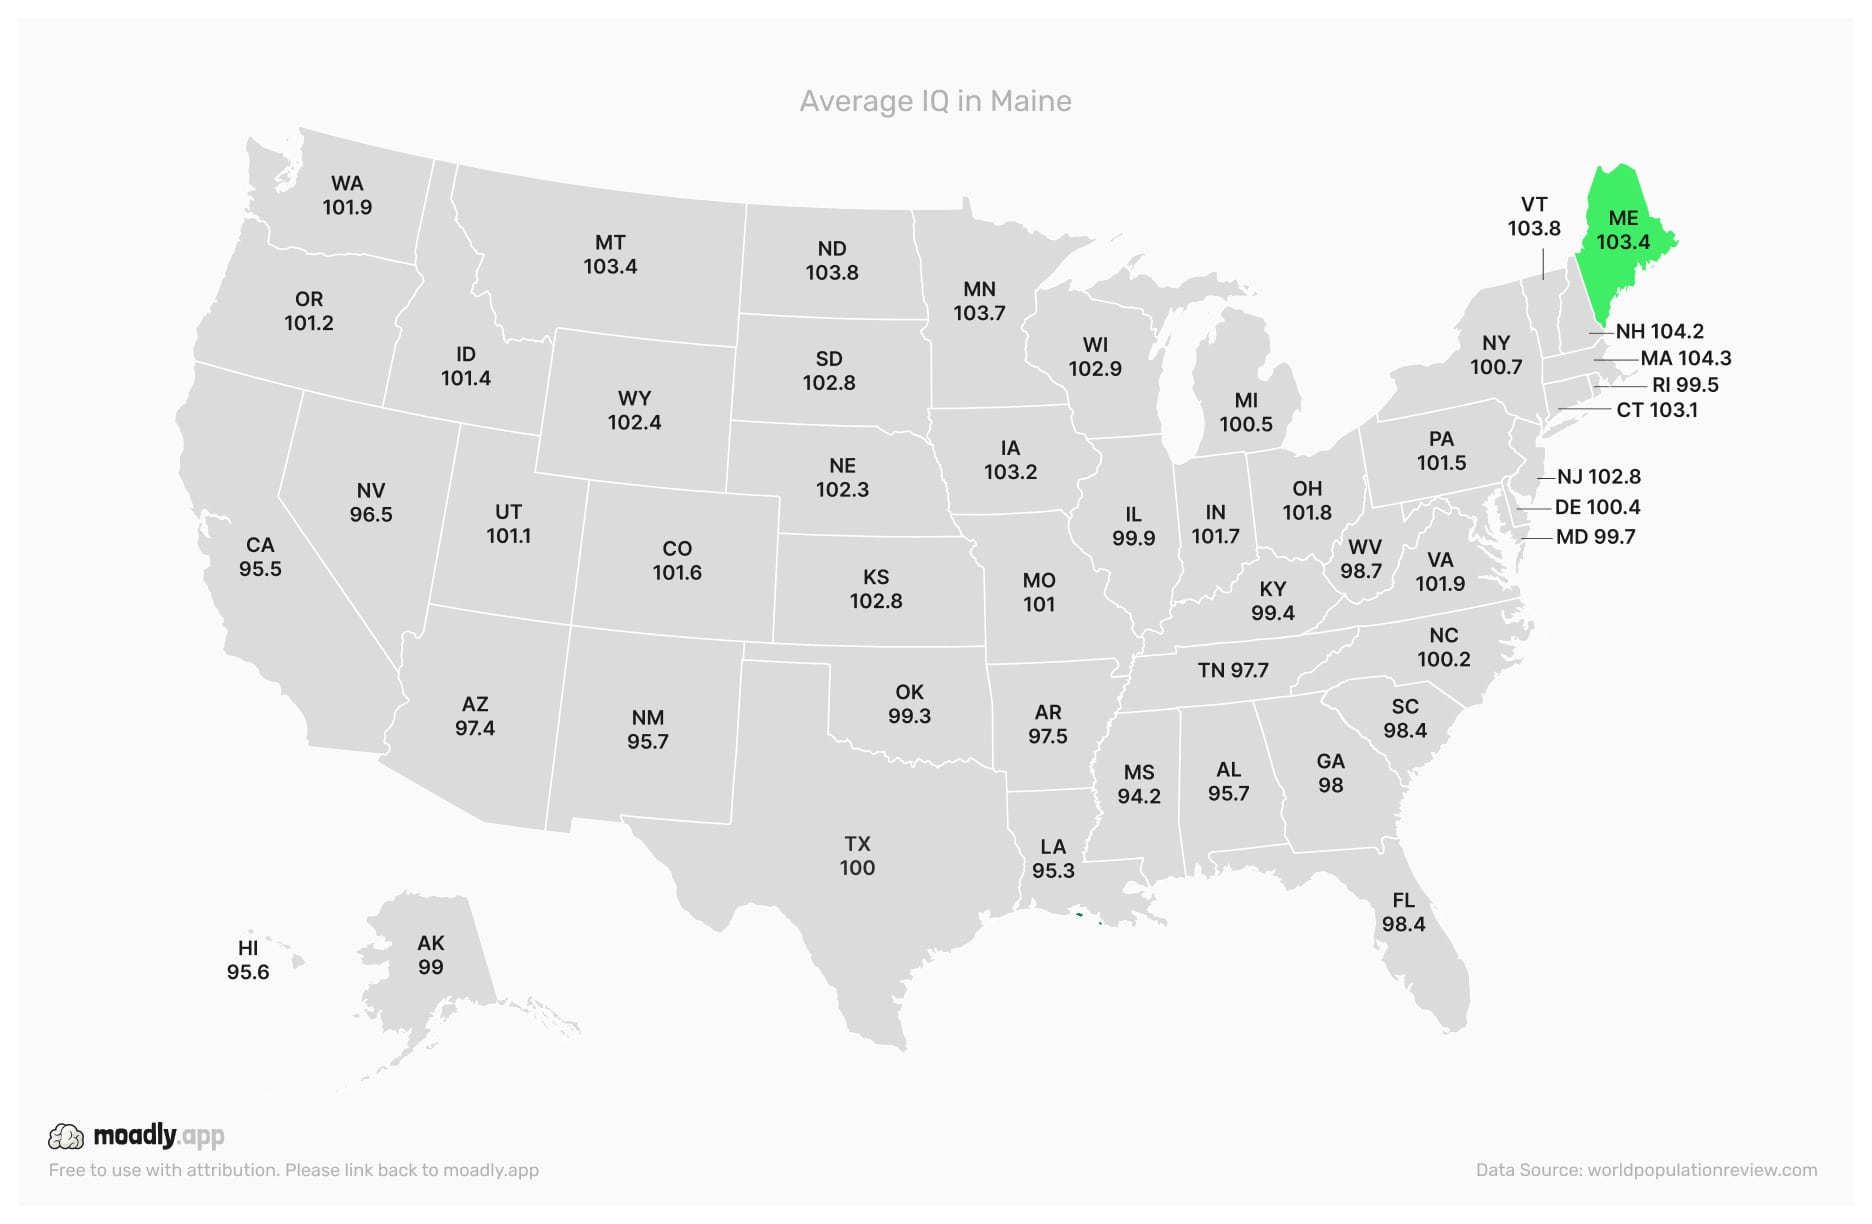
Maine’s small population and focus on community-based education contribute to moderate and consistent IQ outcomes.
Average IQ in Maryland
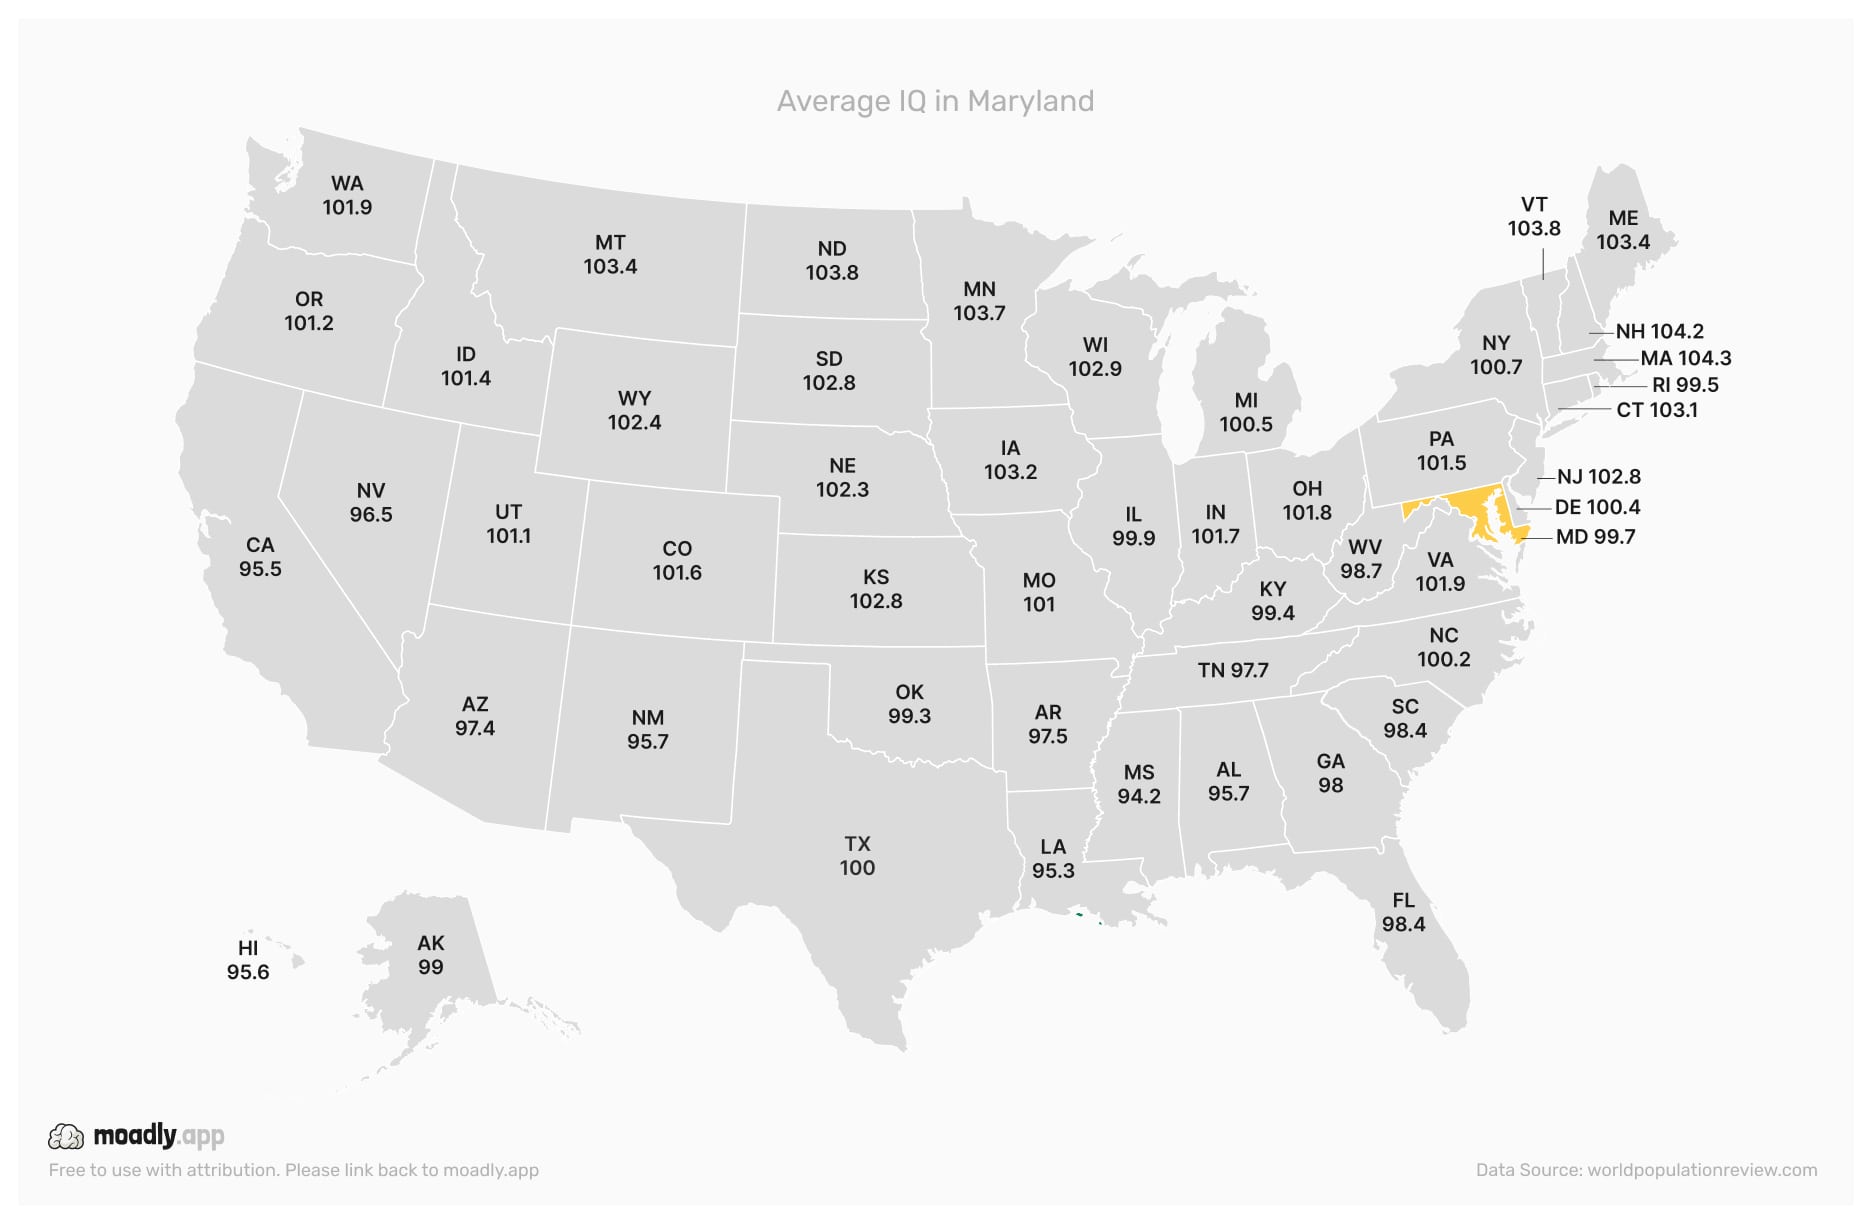
Maryland’s proximity to federal institutions and well-funded districts supports higher average IQ performance across the state.
Average IQ in Massachusetts
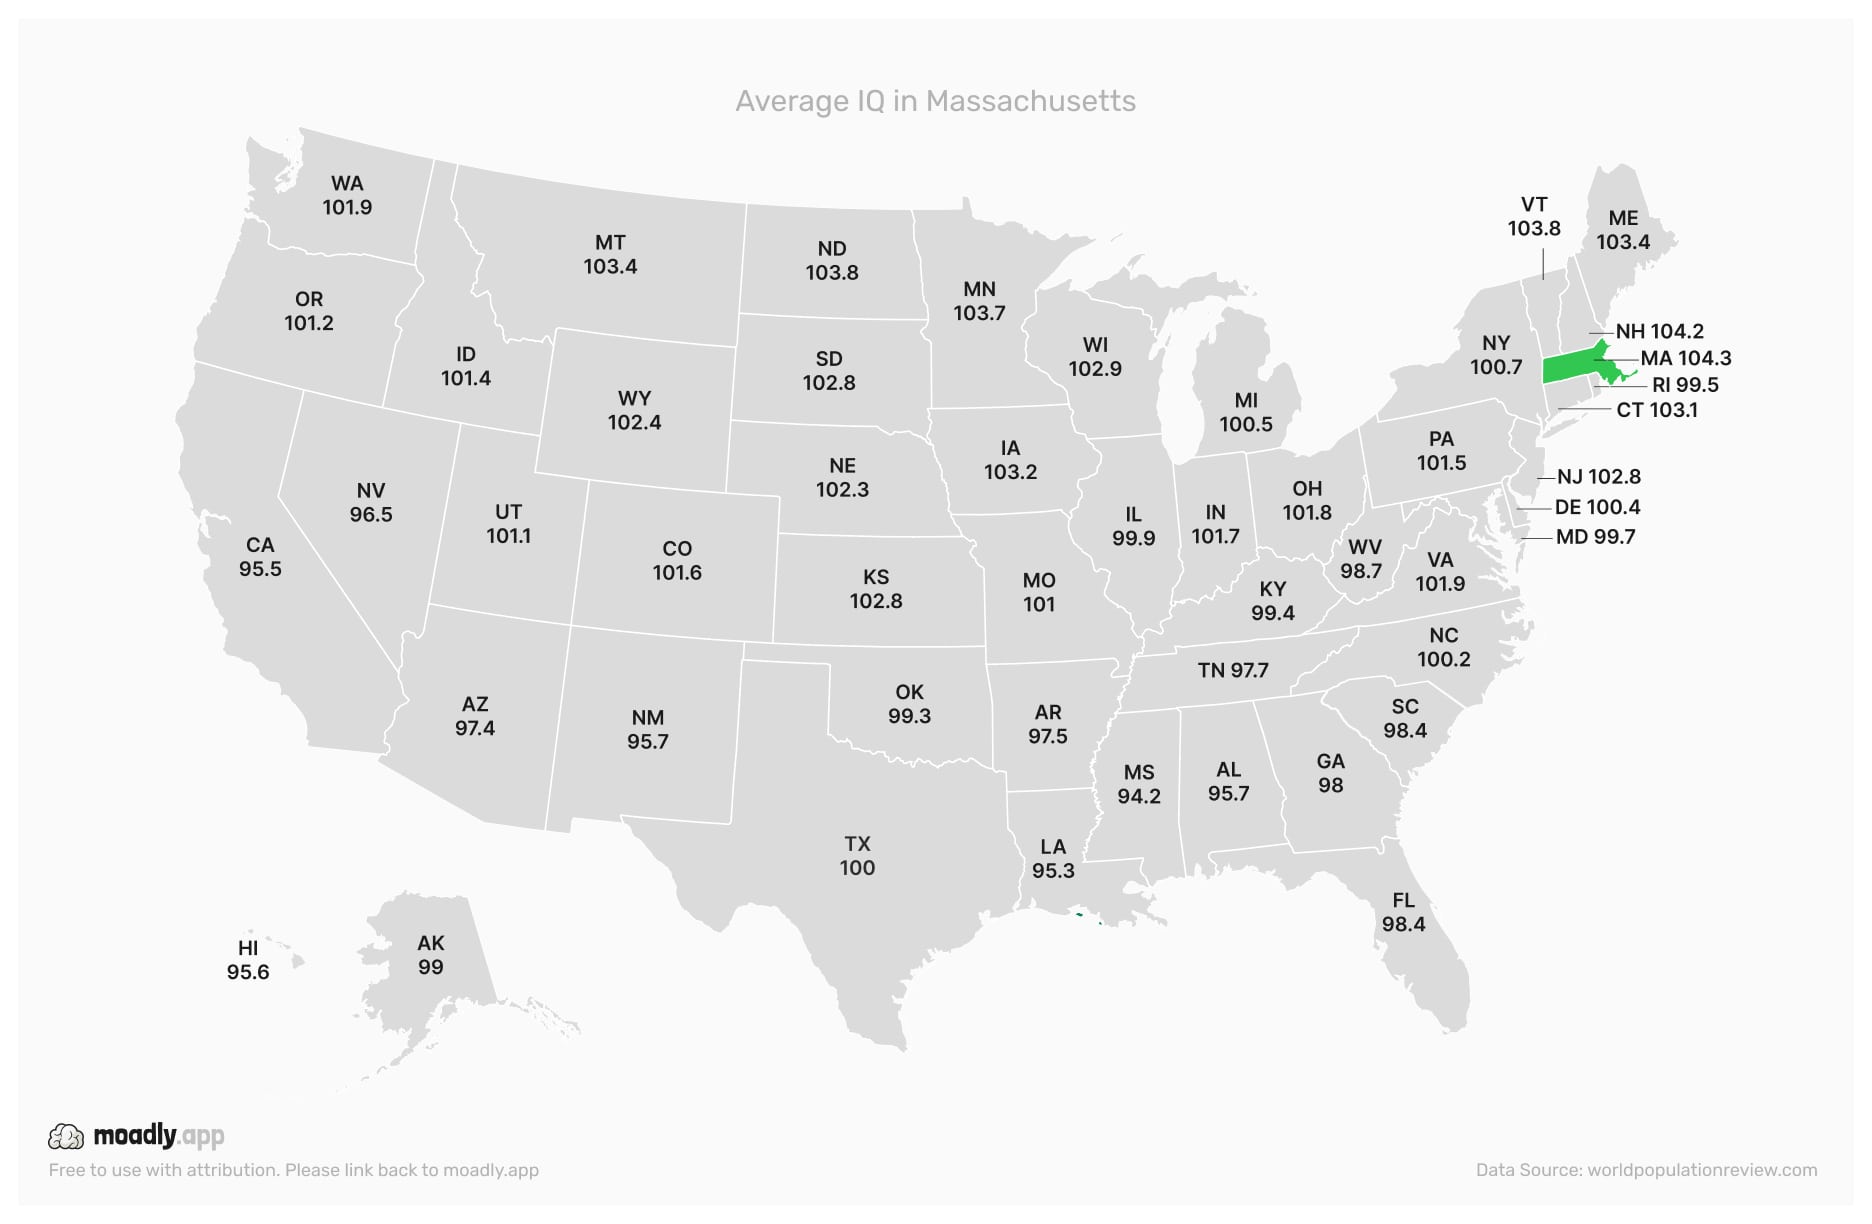
Massachusetts benefits from historic academic institutions and high-quality public schools, resulting in above-average IQ levels.
Average IQ in Michigan
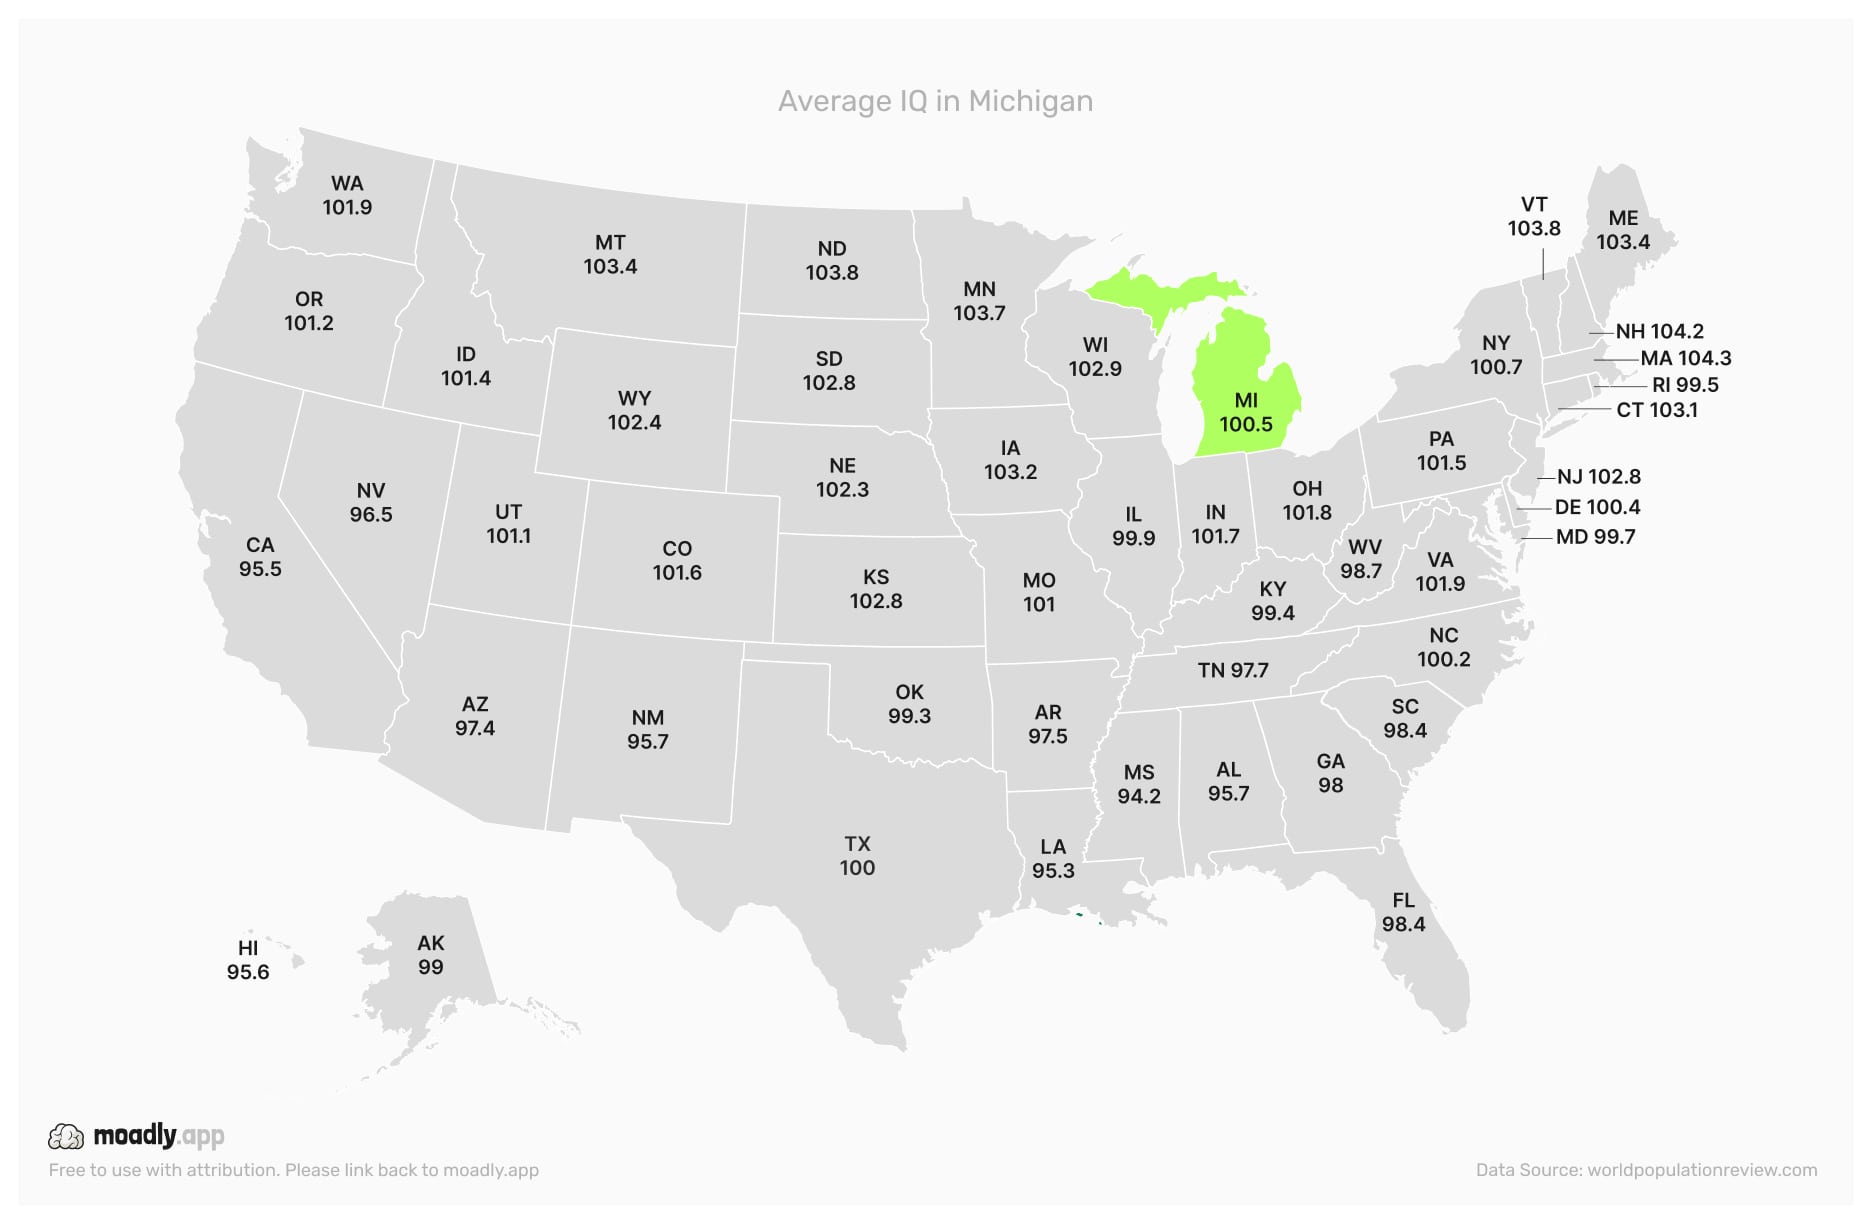
Michigan’s mix of industrial cities and rural areas creates variation in school quality, reflected in the state’s average IQ.
Average IQ in Minnesota
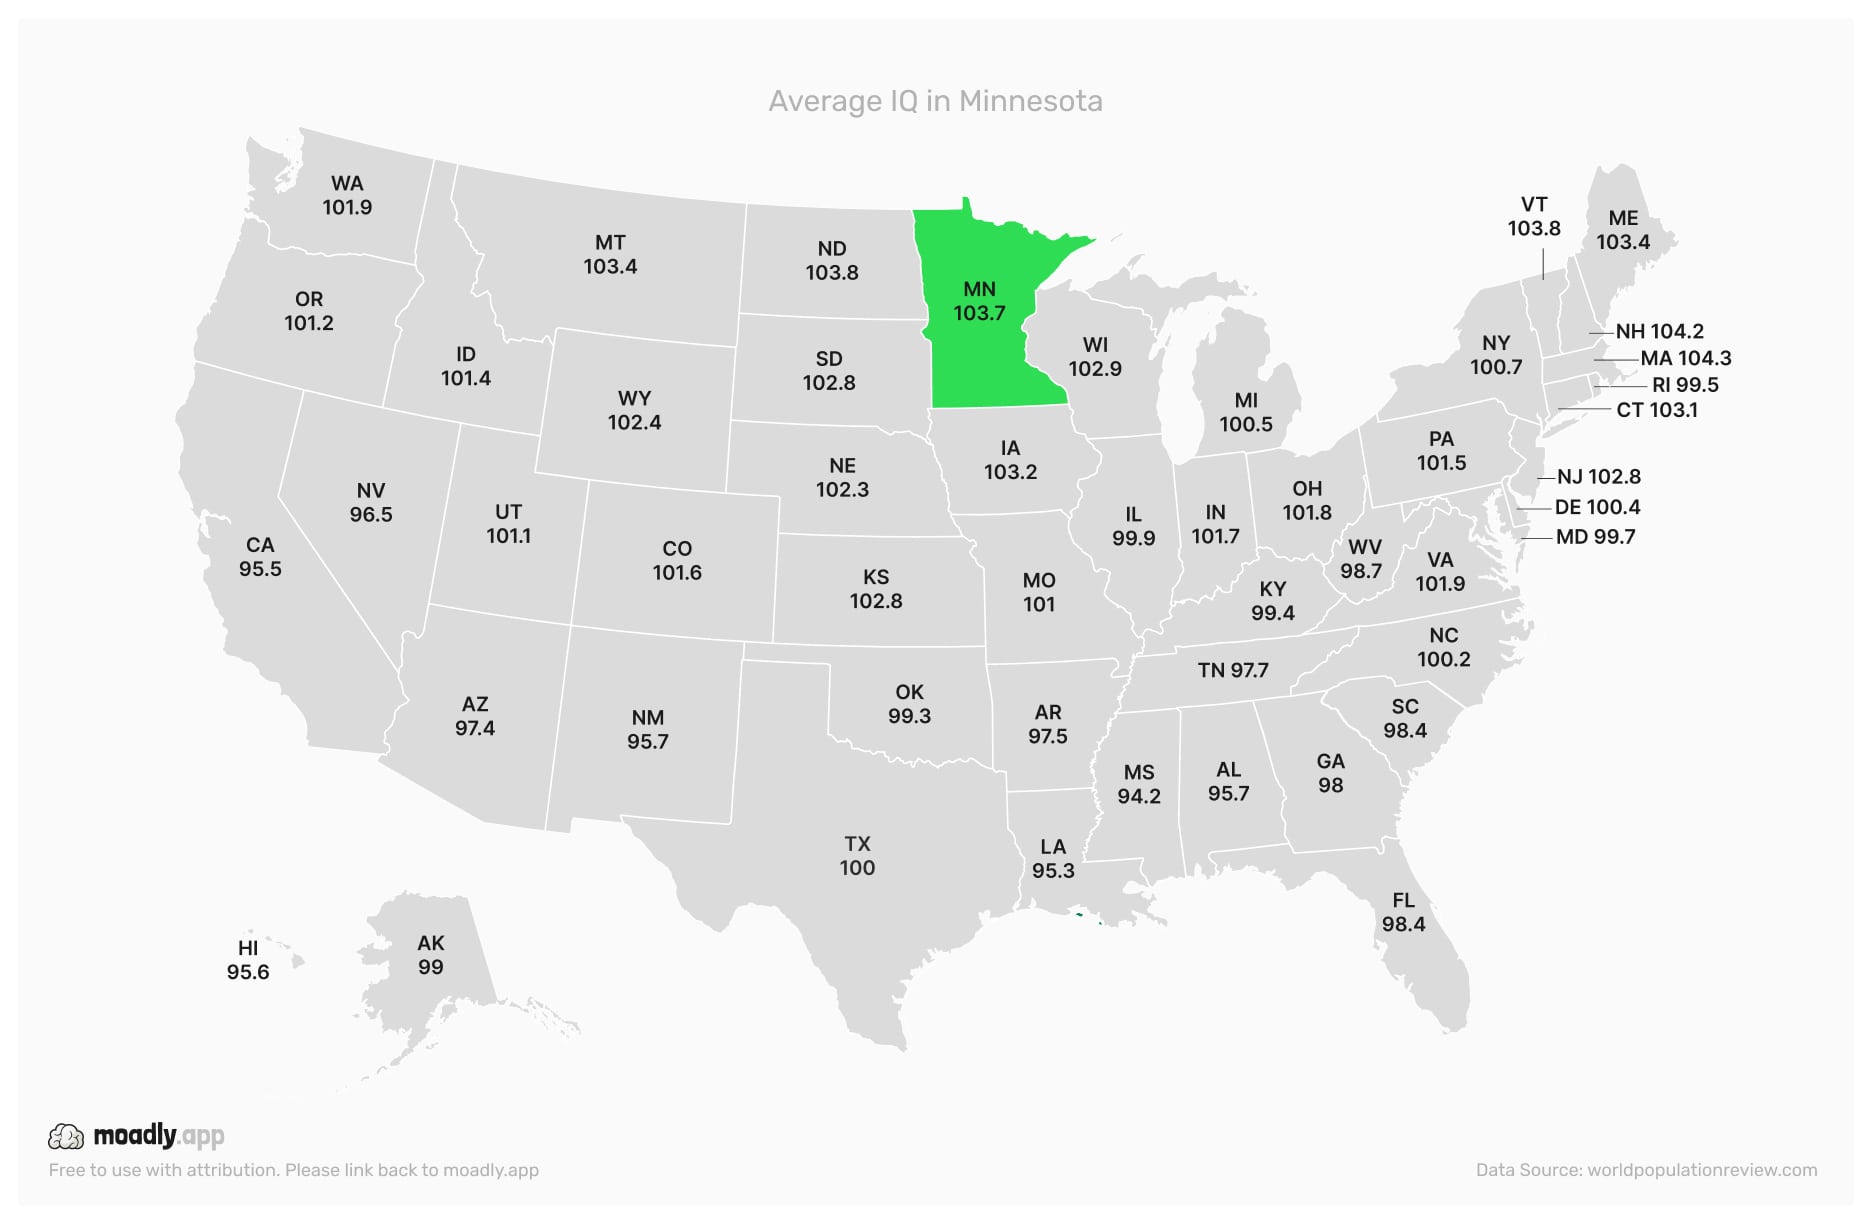
Minnesota’s strong public education system and urban-rural balance contribute to consistent IQ outcomes statewide.
Average IQ in Mississippi
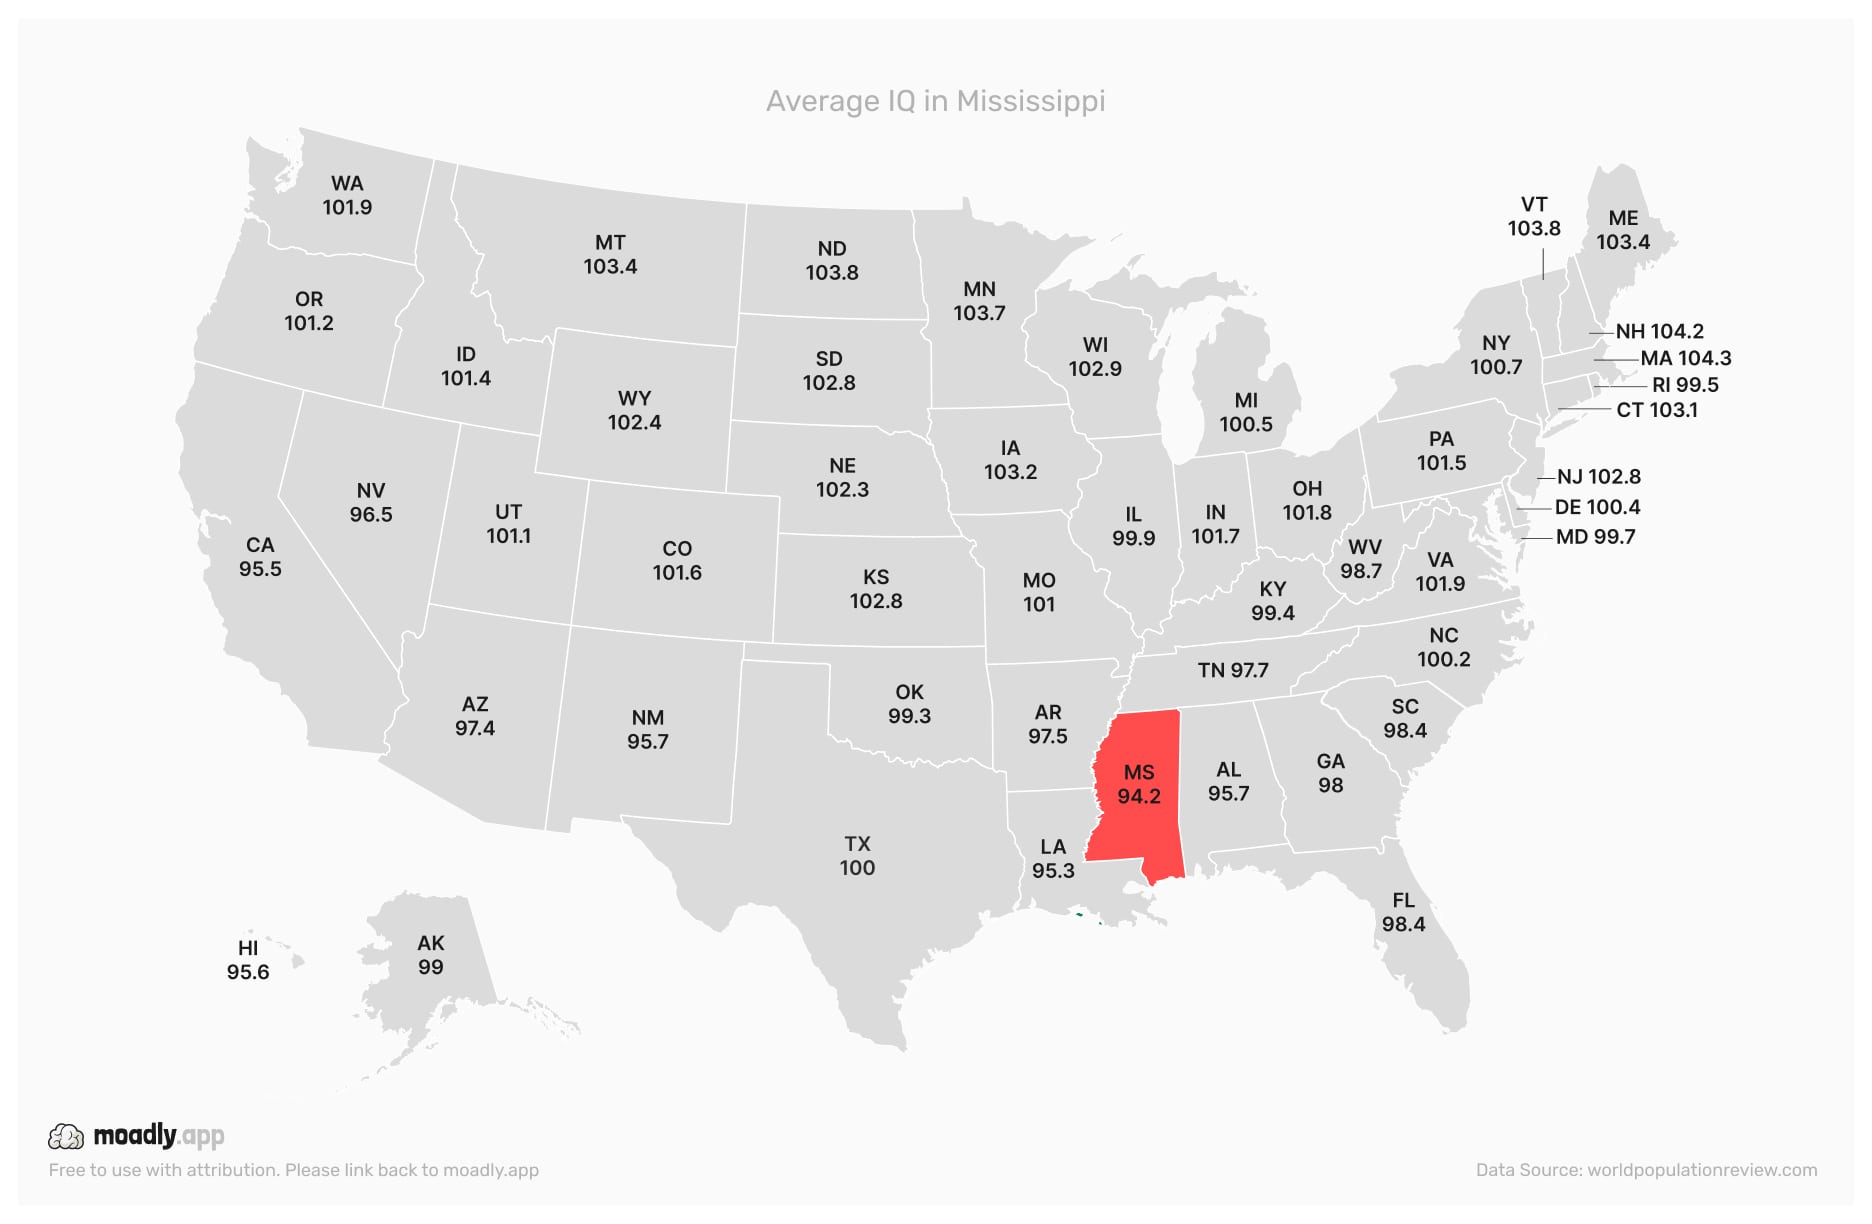
Mississippi faces educational funding challenges and rural access issues, which influence its lower average IQ relative to national levels.
Average IQ in Missouri
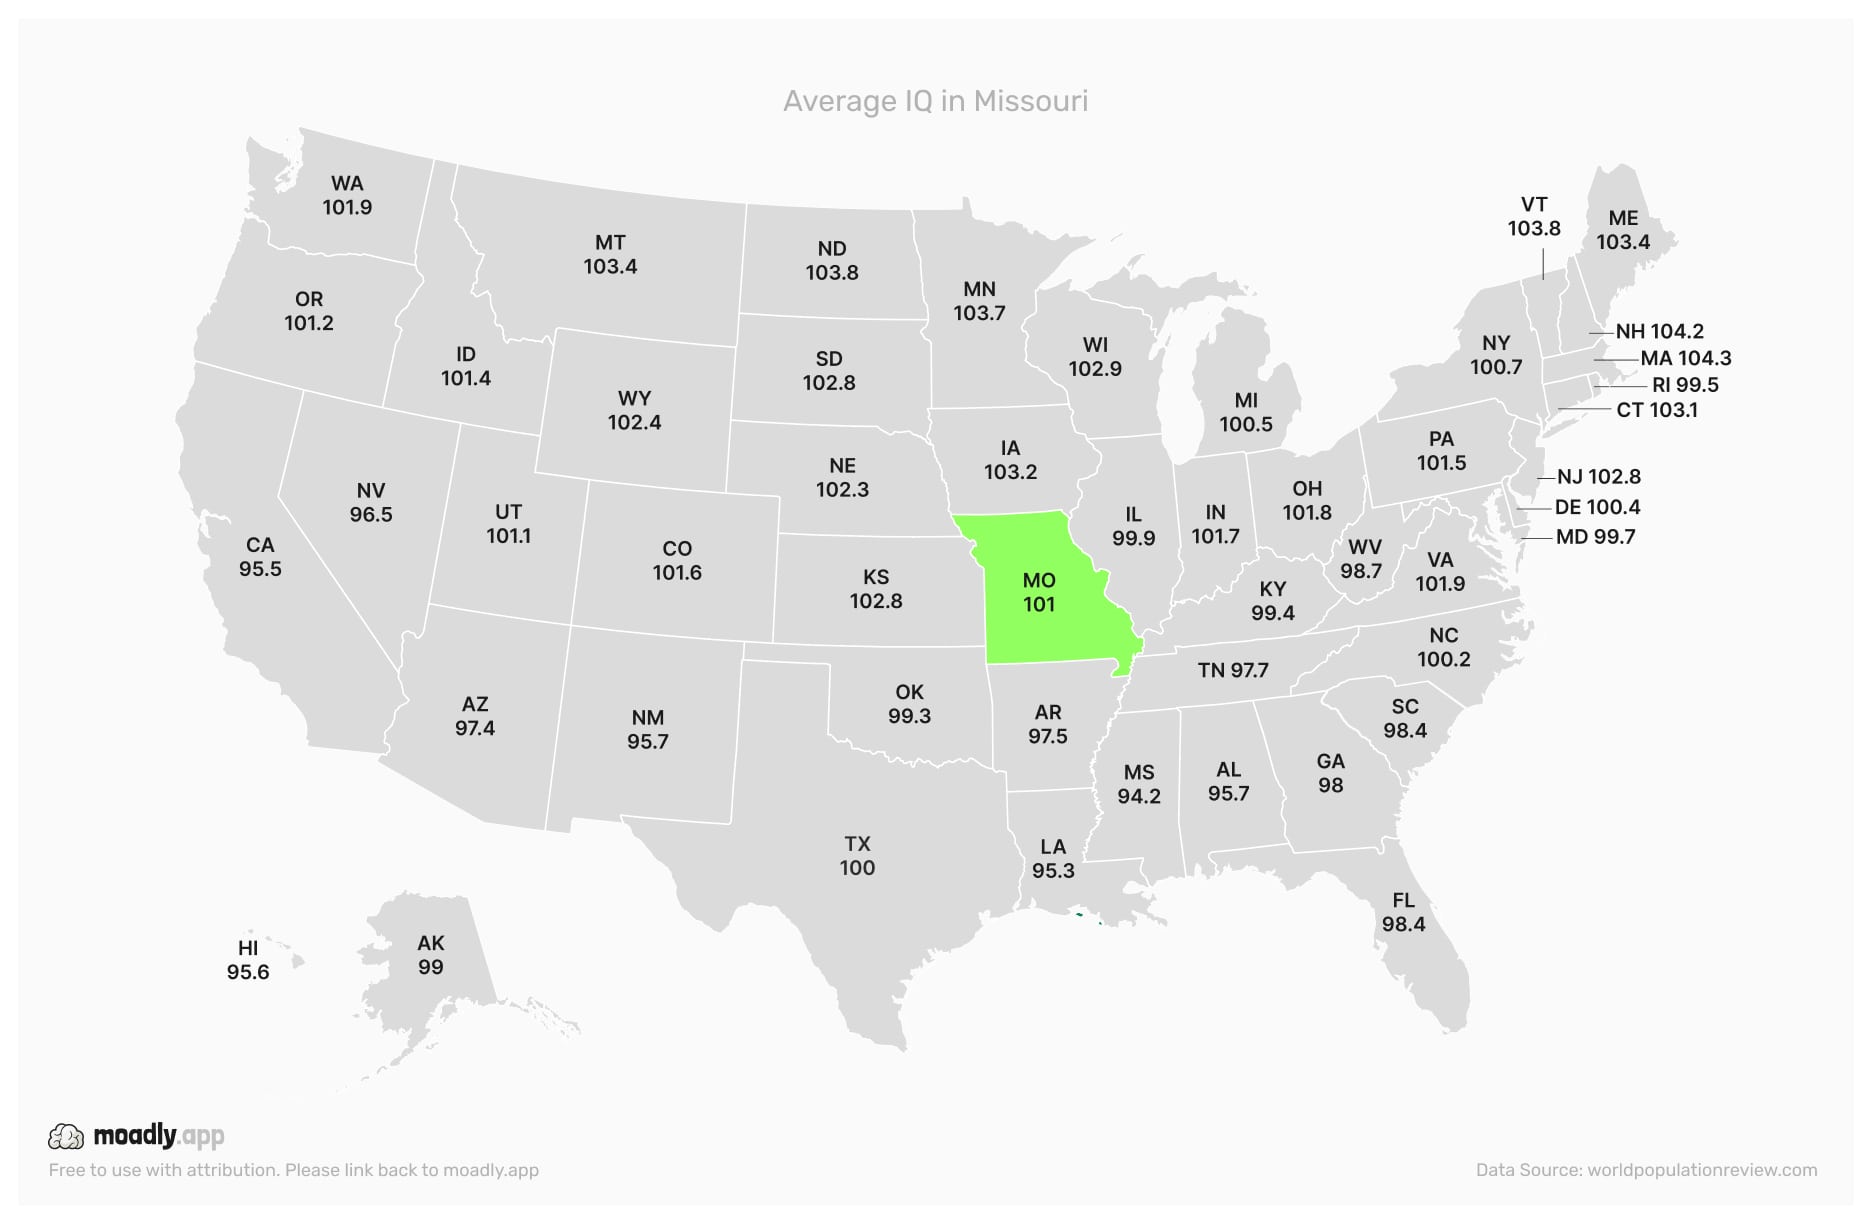
Missouri has diverse educational outcomes between urban centers like St. Louis and rural counties, resulting in varied IQ averages.
Average IQ in Montana

Montana's sparse population and remote communities create unique educational challenges, influencing the state’s average IQ.
Average IQ in Nebraska
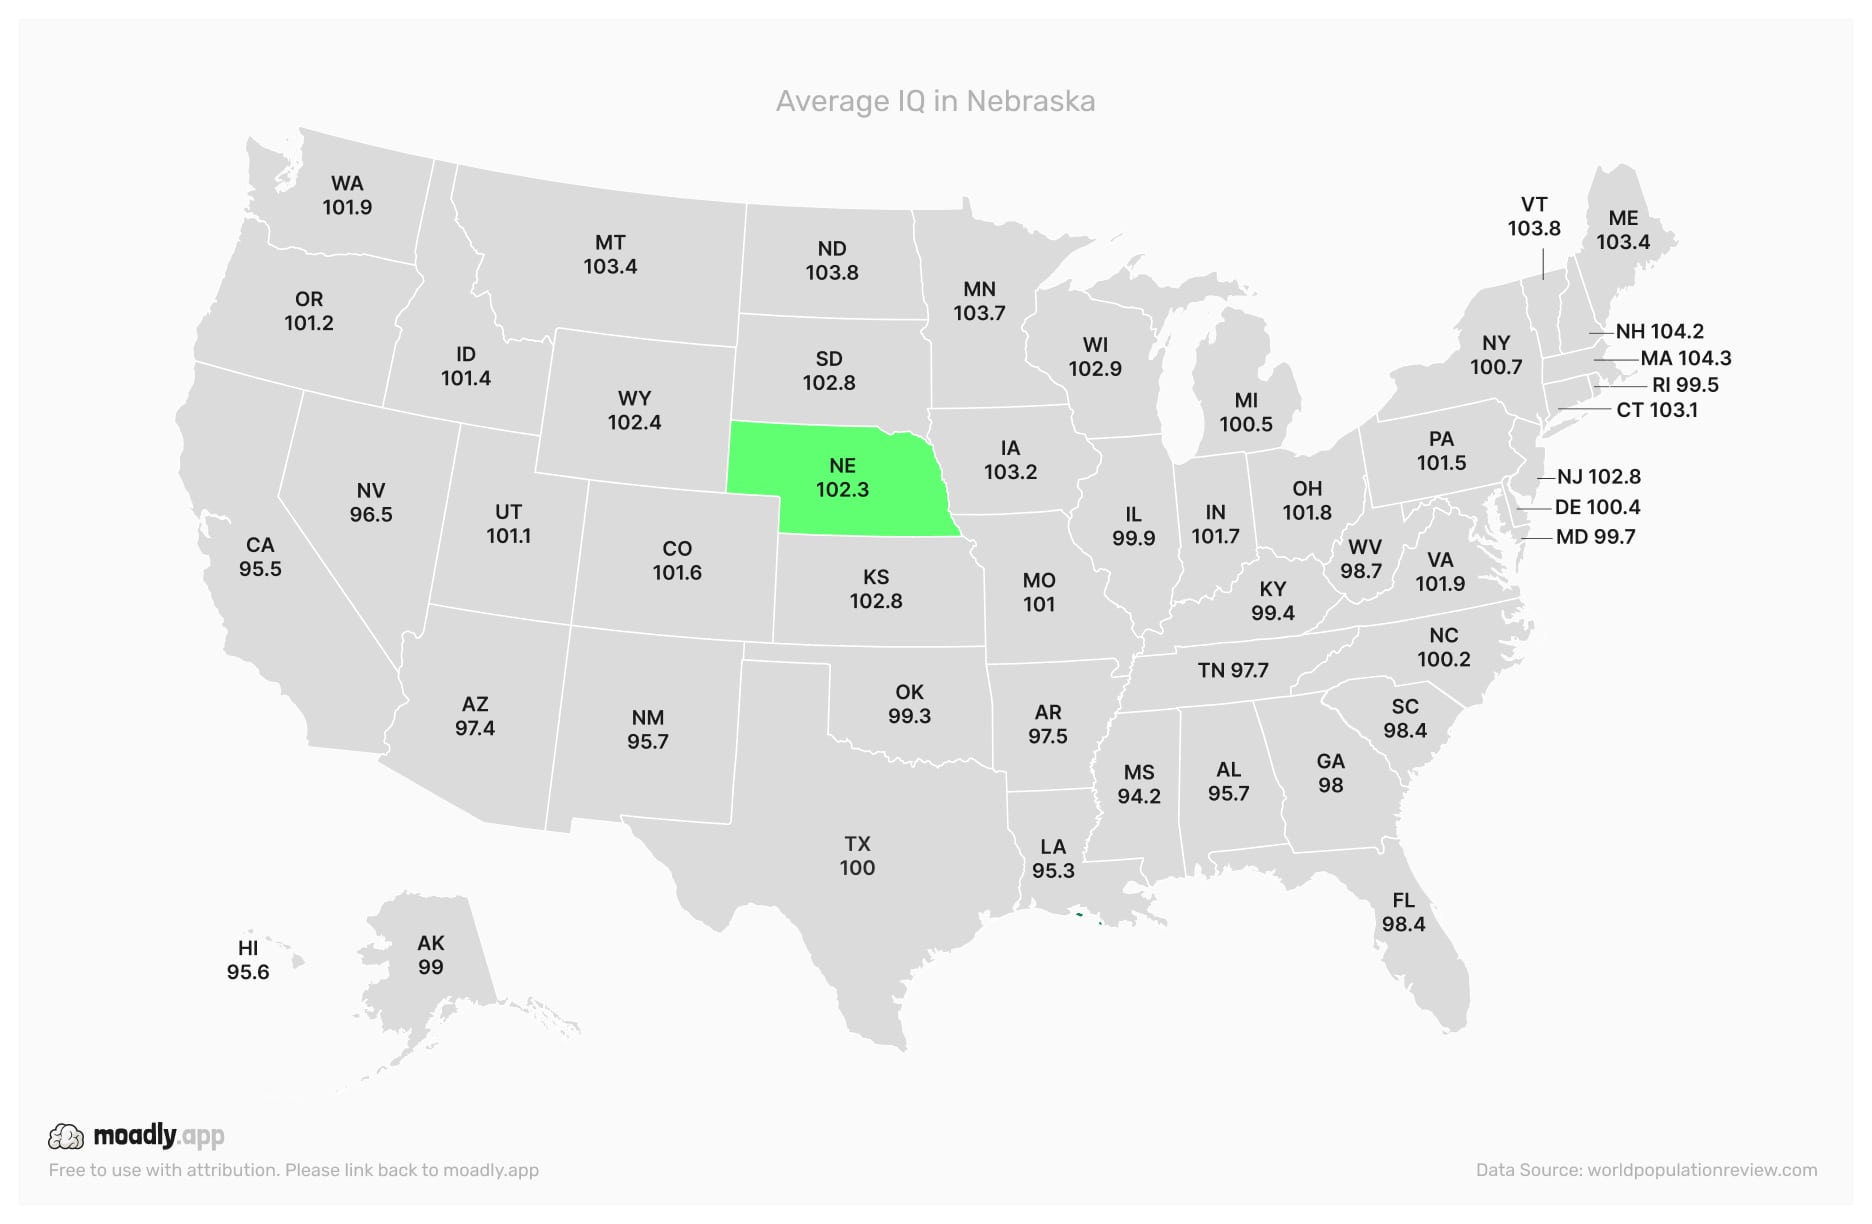
Nebraska’s strong public schools and focus on community education support steady IQ outcomes across the state.
Average IQ in Nevada

Nevada's rapid urban growth in Las Vegas and Reno contrasts with rural regions, creating a mix of educational access that affects average IQ.
Average IQ in New Hampshire
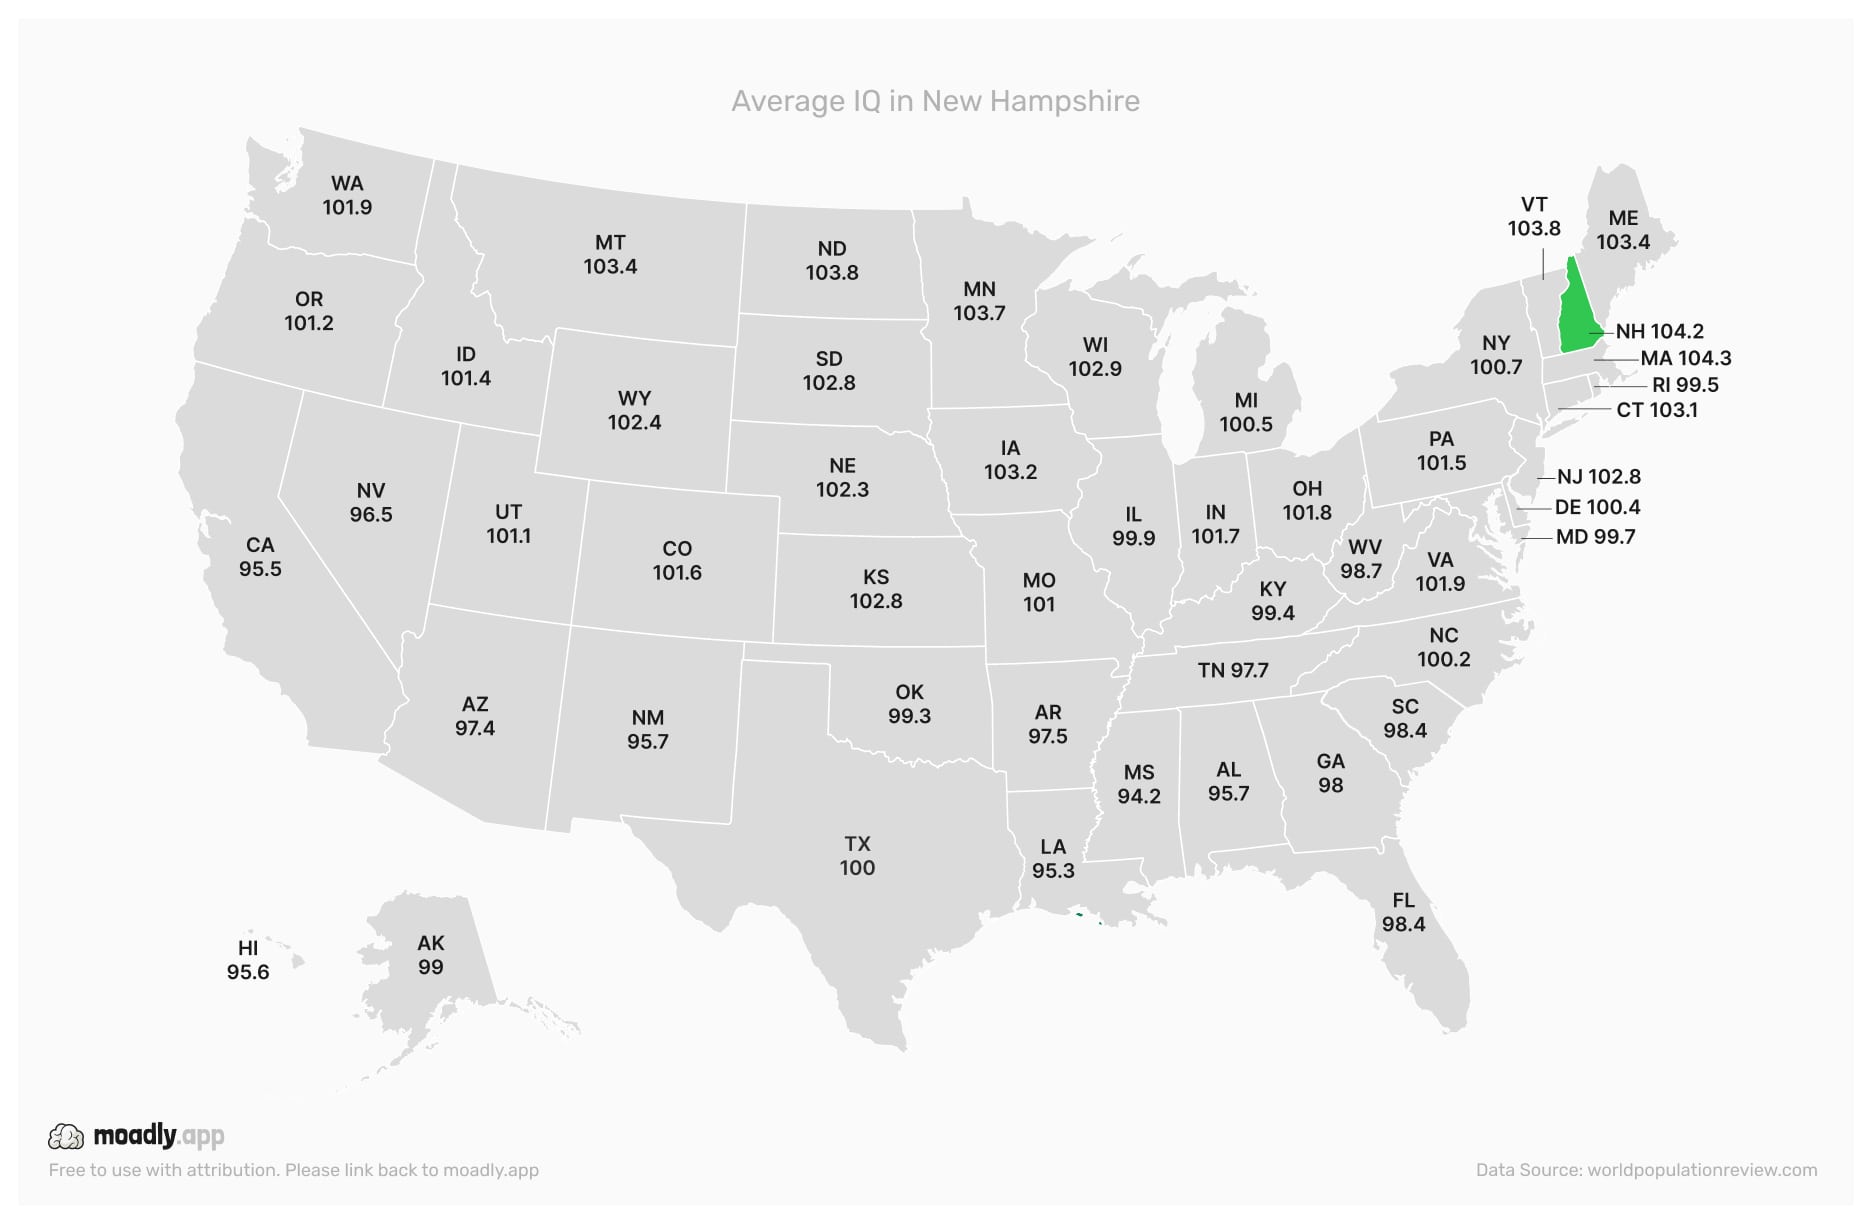
New Hampshire benefits from high-quality public schools and affluent communities, leading to consistently strong IQ results.
Average IQ in New Jersey
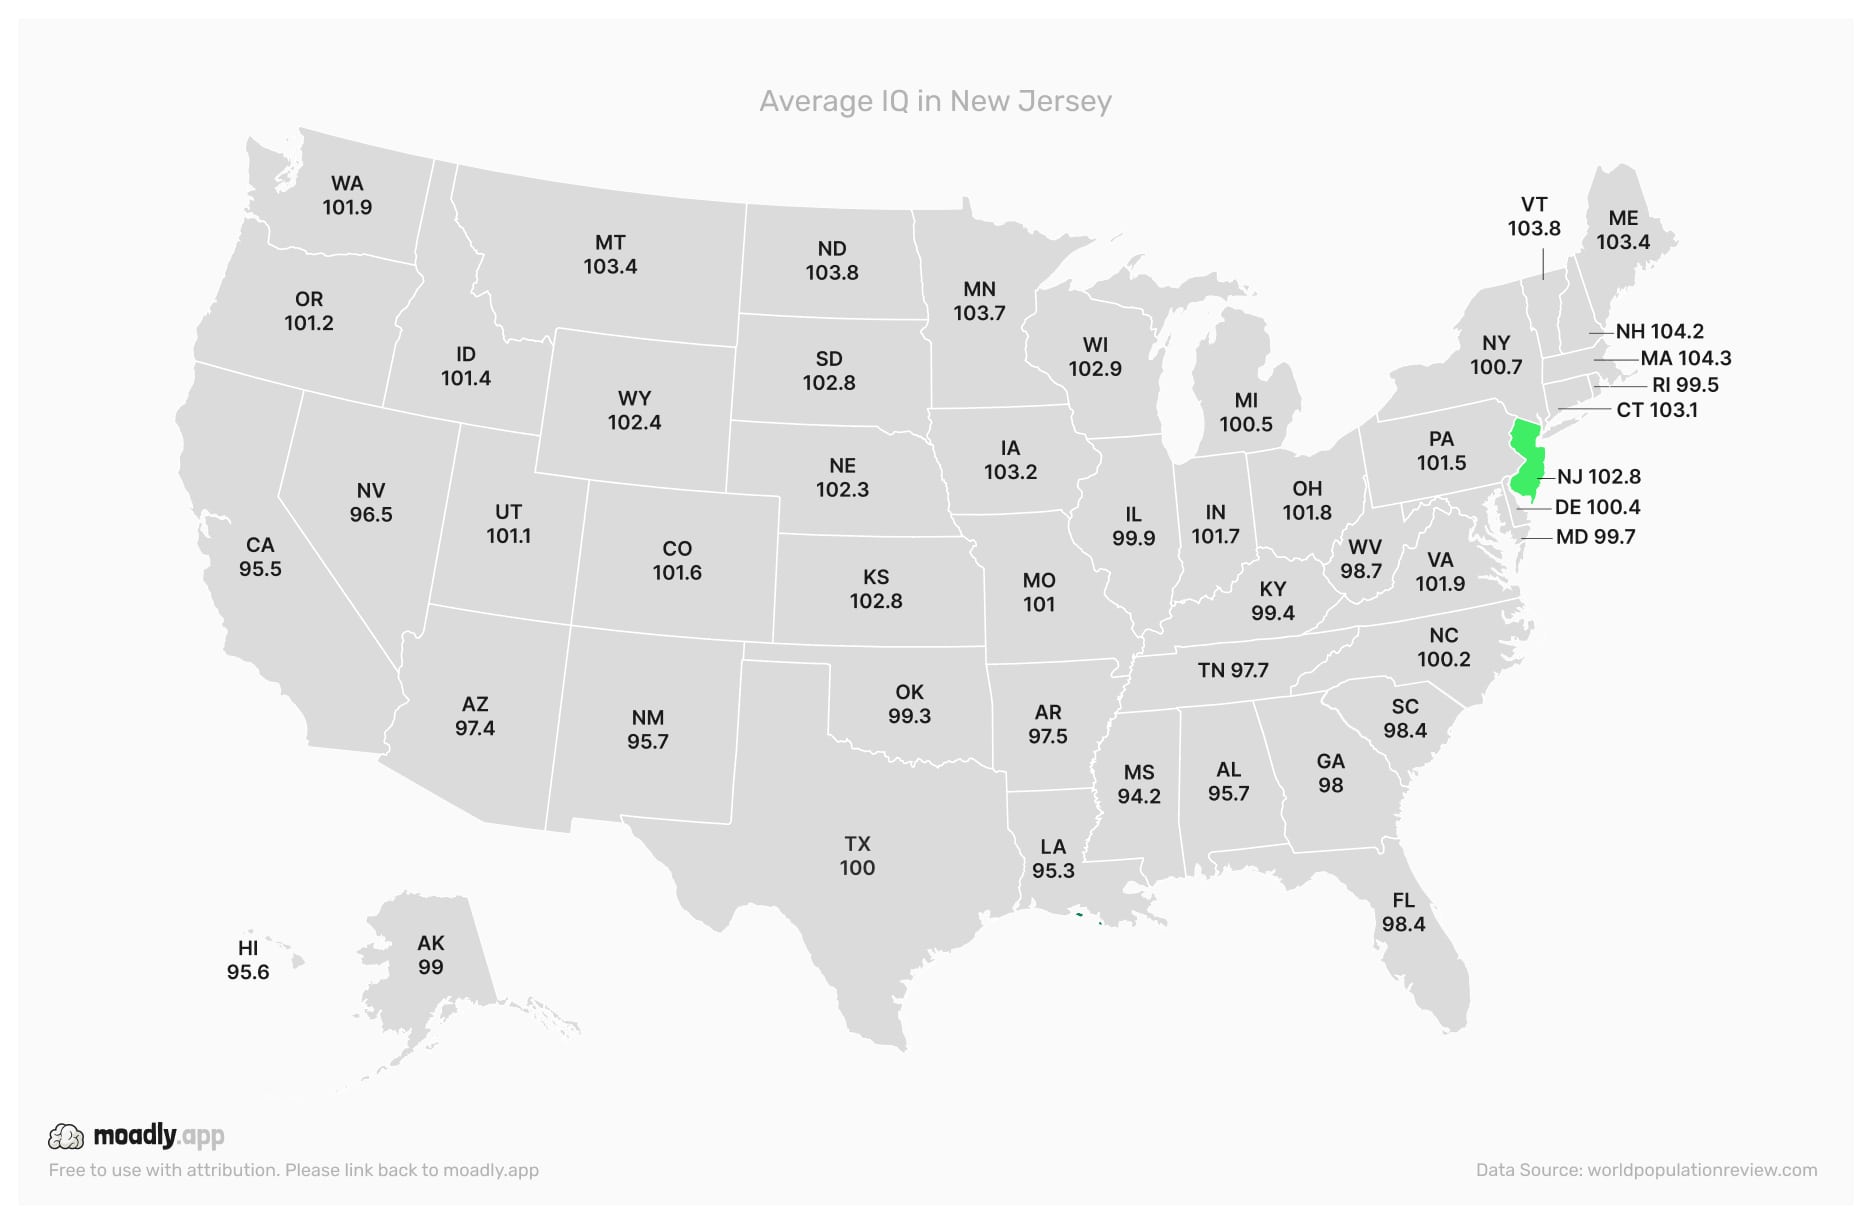
New Jersey’s well-funded school districts and proximity to major metropolitan areas support higher average IQ levels.
Average IQ in New Mexico

New Mexico faces challenges in rural education access and diverse populations, which influence the state’s IQ outcomes.
Average IQ in New York

New York's dense urban centers and strong educational institutions contribute to high average IQ levels, with regional variation.
Average IQ in North Carolina
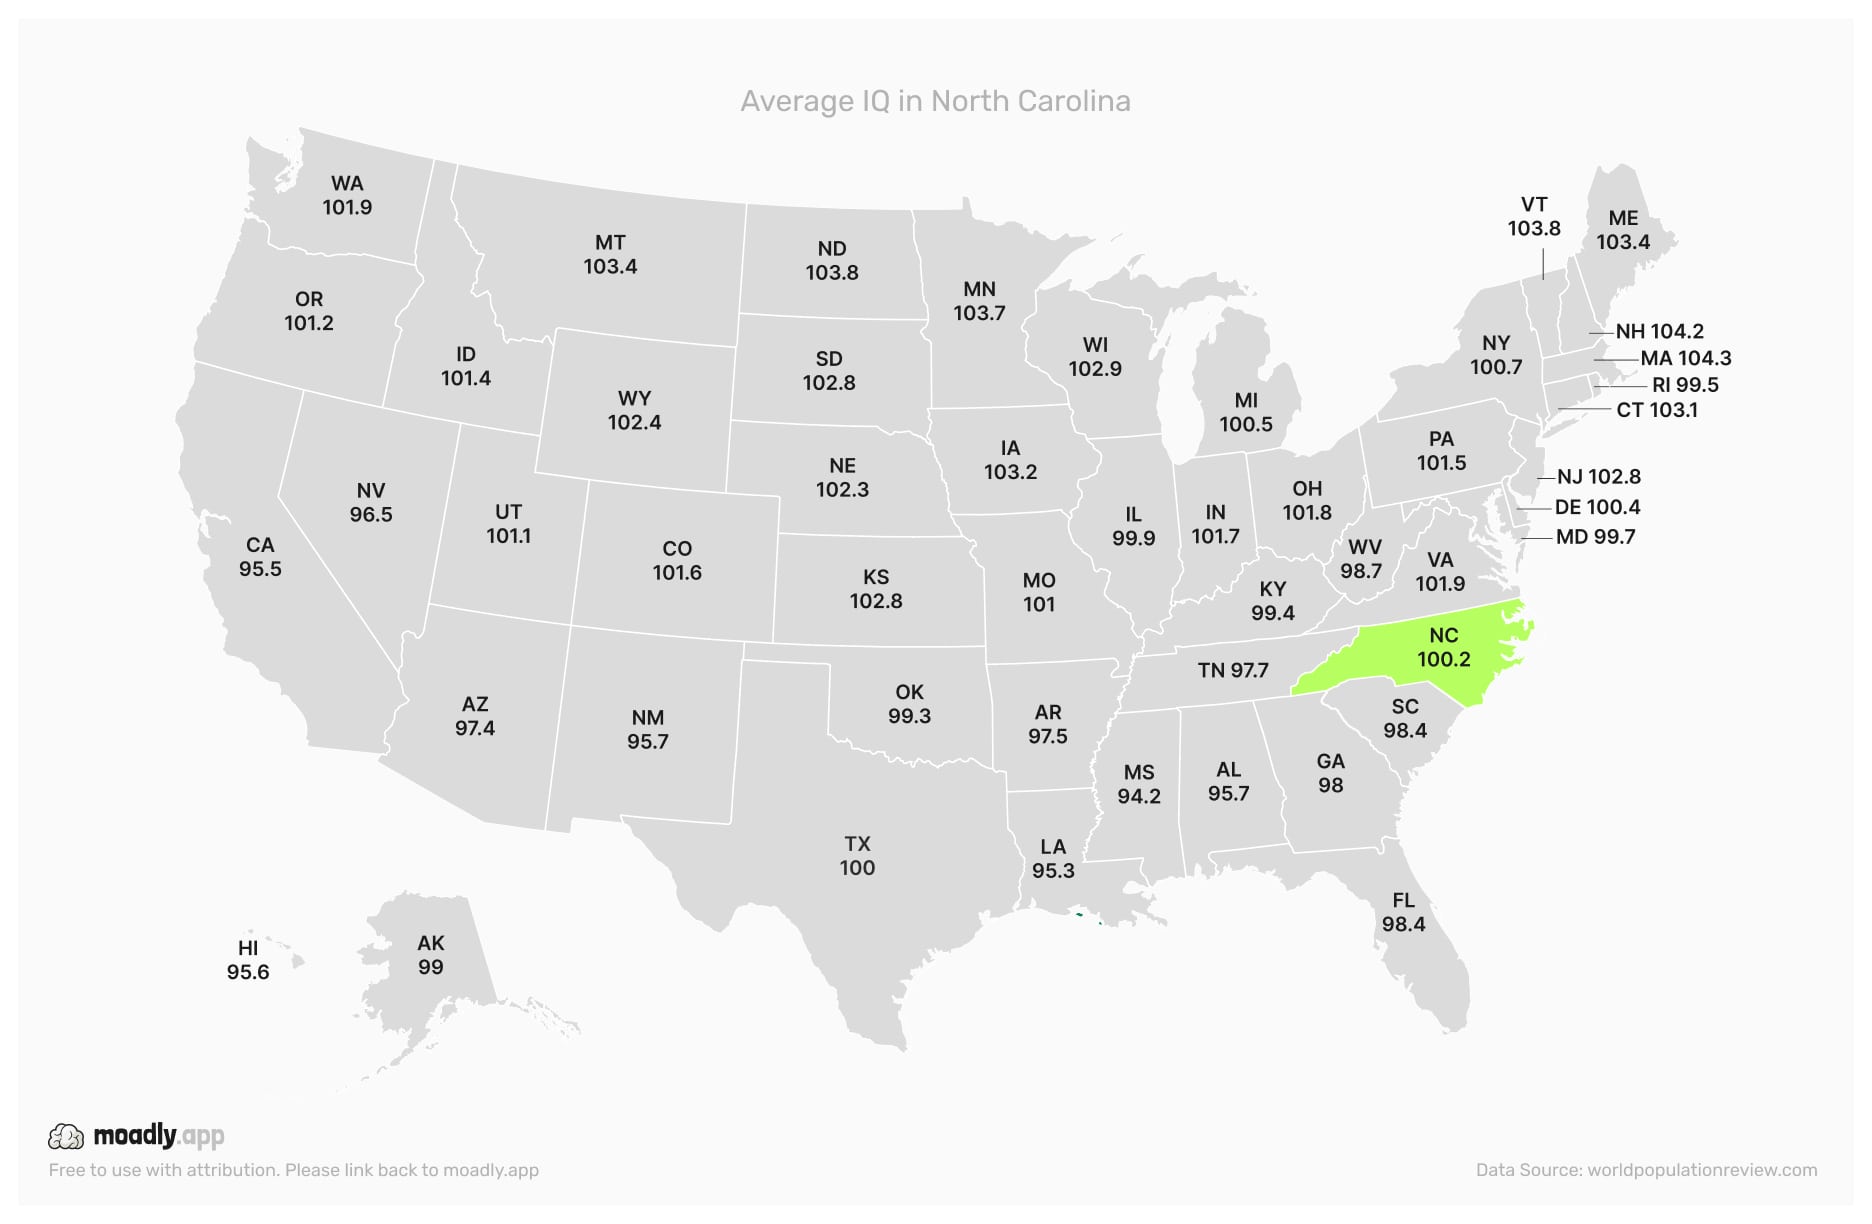
North Carolina’s mix of research universities and rural areas shapes educational outcomes and statewide average IQ.
Average IQ in North Dakota

North Dakota’s small population and strong rural community schools support consistent IQ outcomes across the state.
Average IQ in Ohio
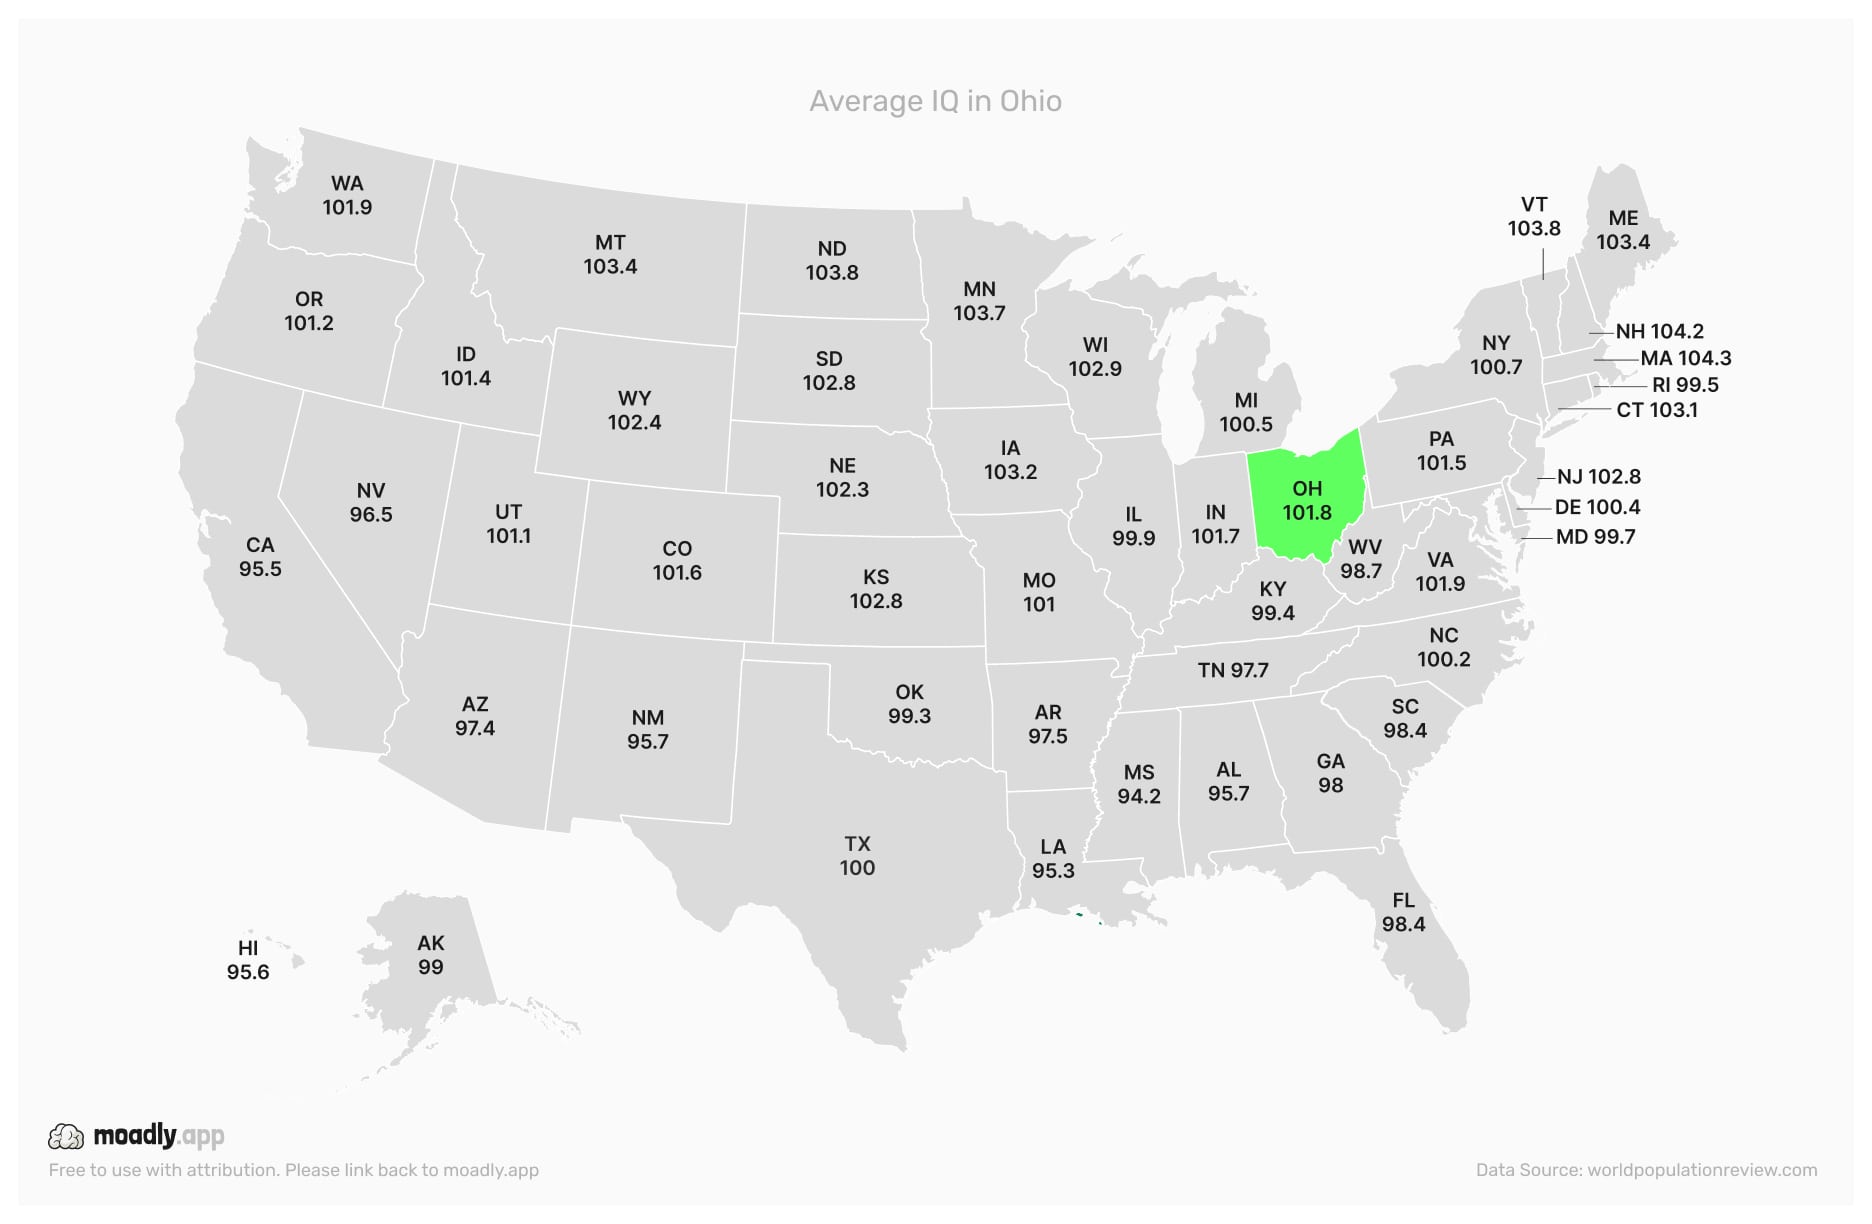
Ohio’s mix of urban and industrial centers alongside rural counties results in diverse educational outcomes and average IQ scores.
Average IQ in Oklahoma
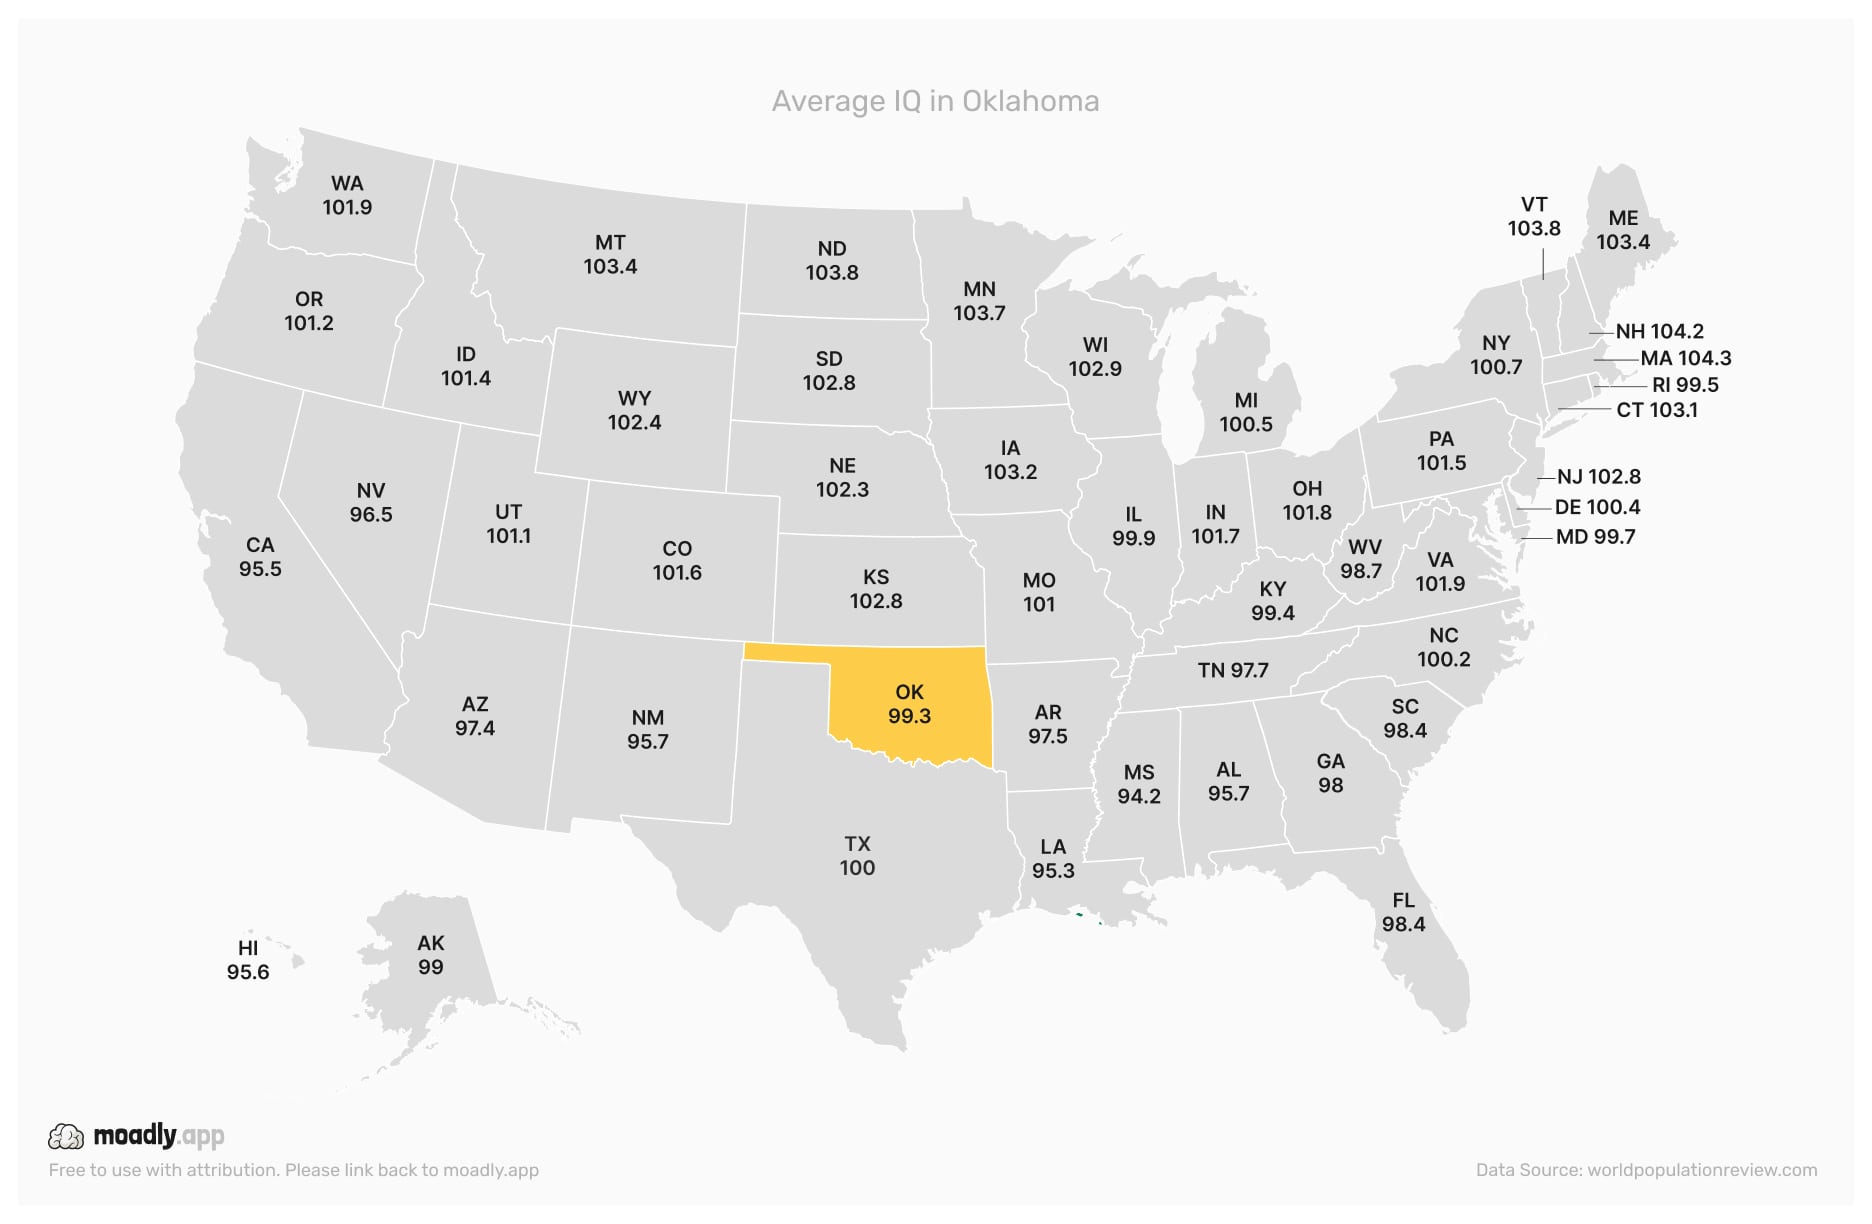
Oklahoma’s rural schools and urban districts create a blend of educational resources that influence statewide IQ outcomes.
Average IQ in Oregon
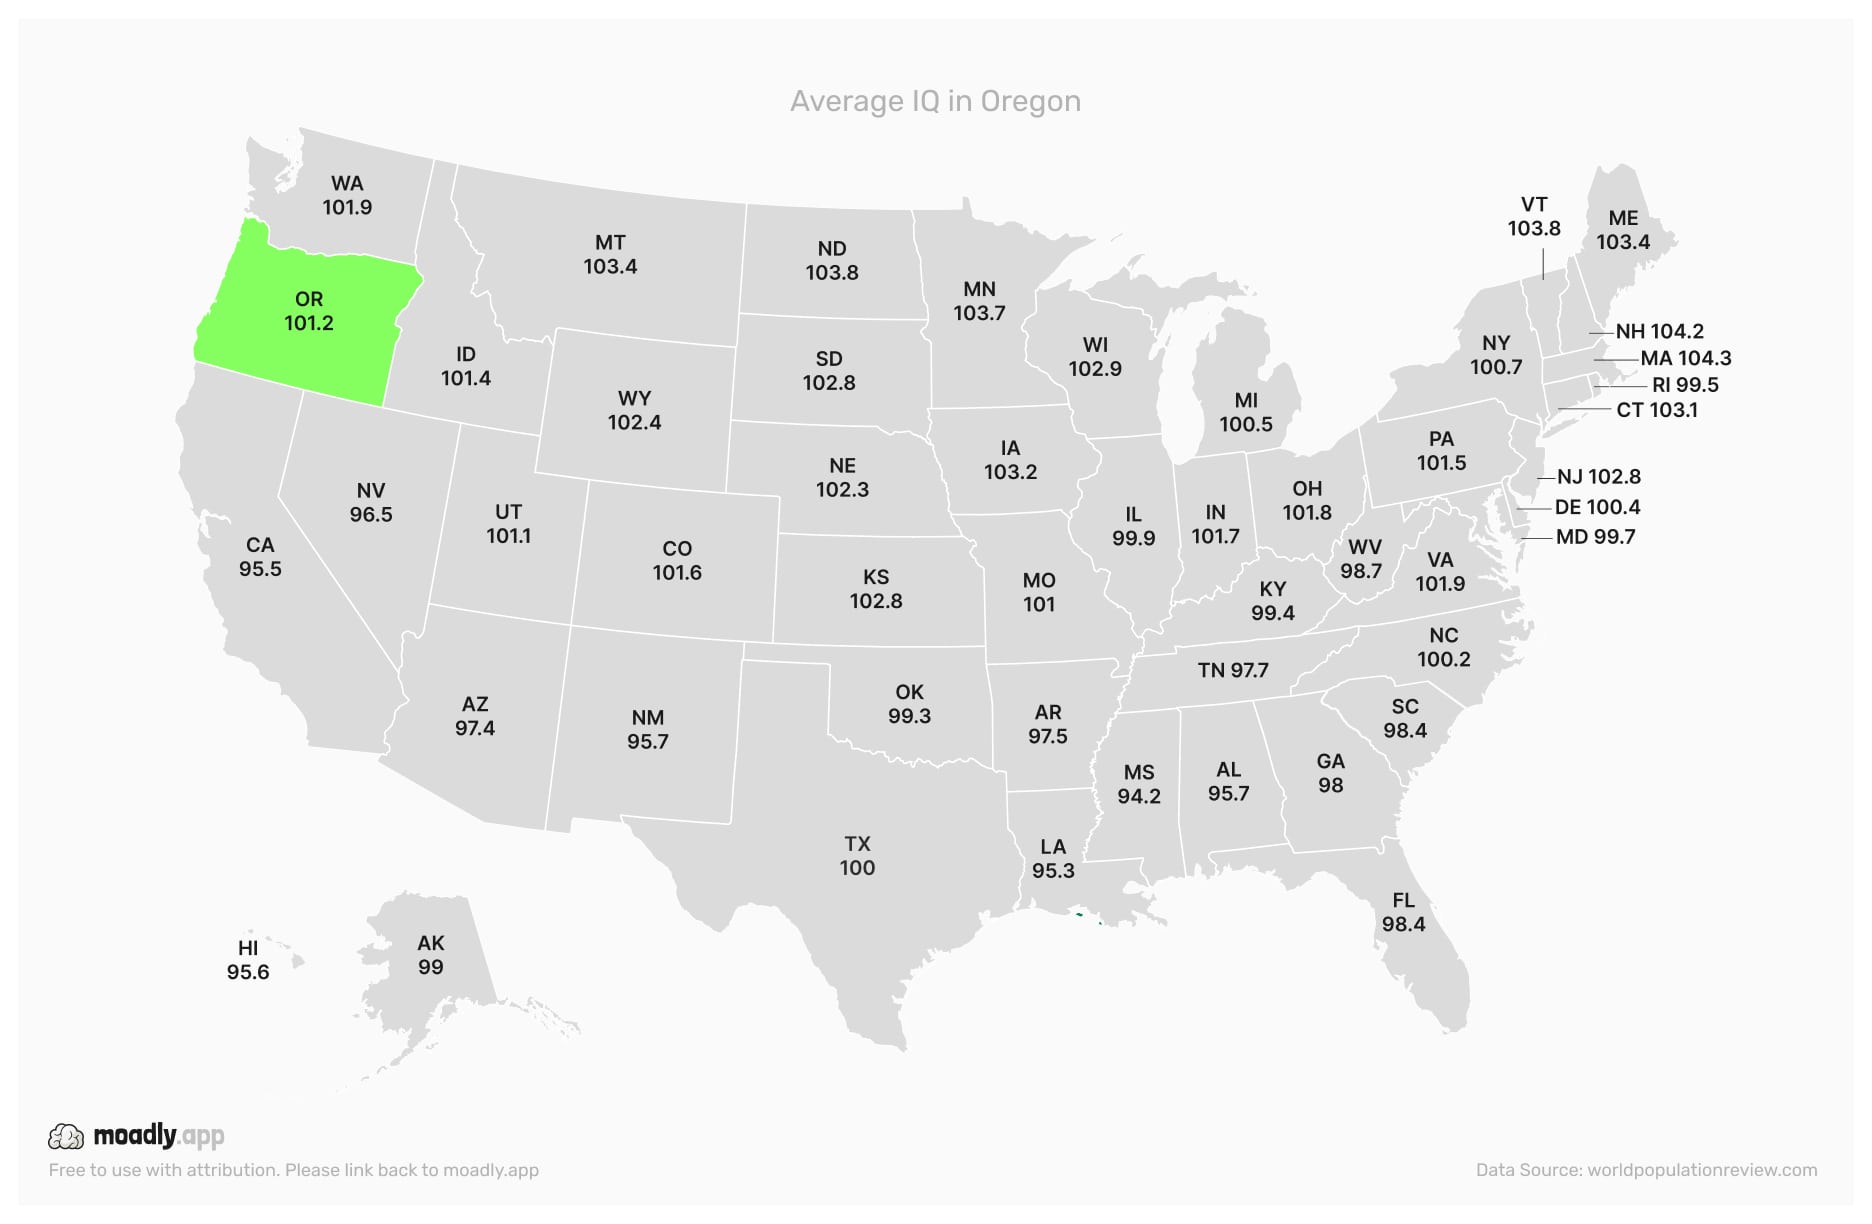
Oregon’s mix of urban tech hubs and rural communities contributes to variation in educational attainment and average IQ.
Average IQ in Pennsylvania
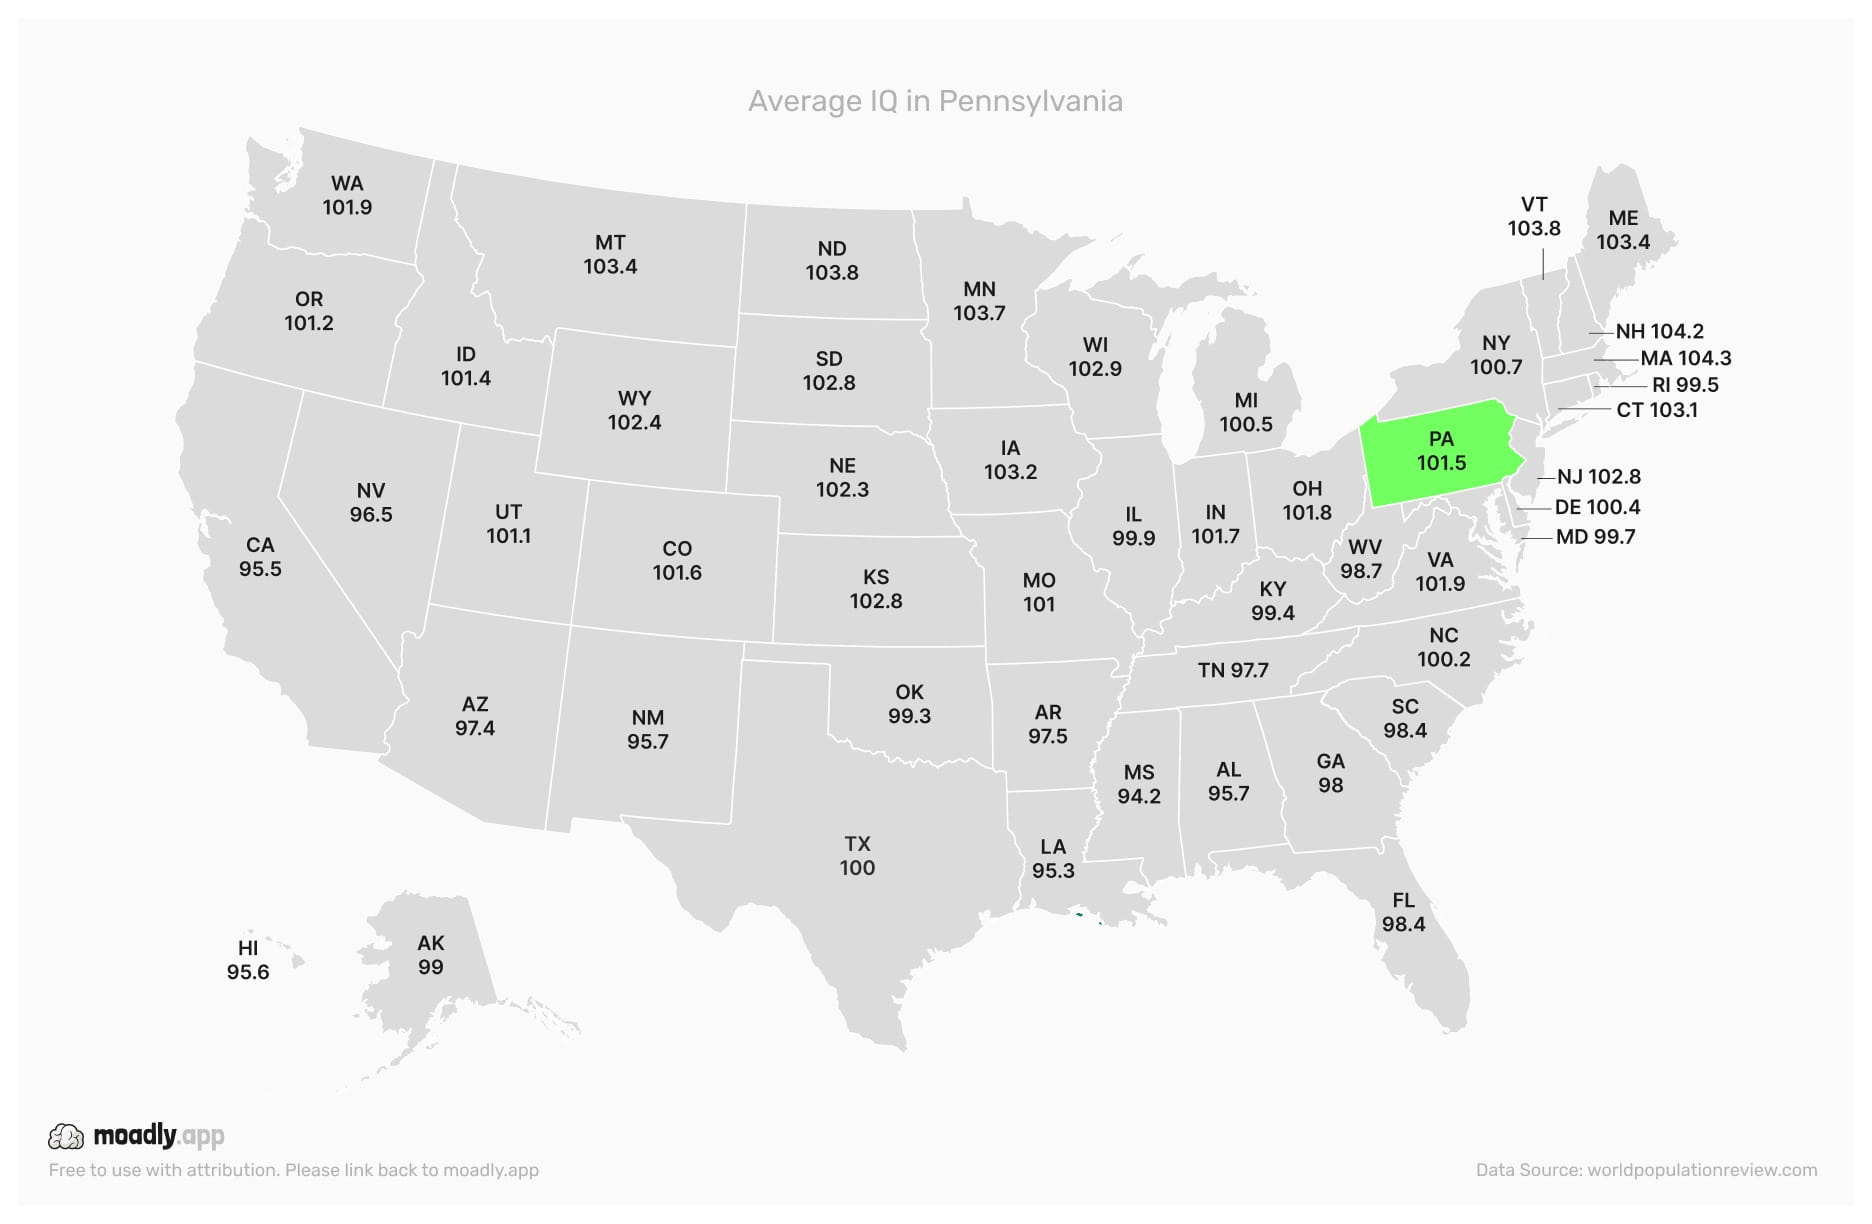
Pennsylvania benefits from strong urban school districts but also faces rural education challenges, reflected in IQ outcomes.
Average IQ in Rhode Island

Rhode Island’s small size and concentrated school districts support focused education policies and consistent IQ levels.
Average IQ in South Carolina

South Carolina’s diverse population and varying school funding levels create regional differences in average IQ.
Average IQ in South Dakota
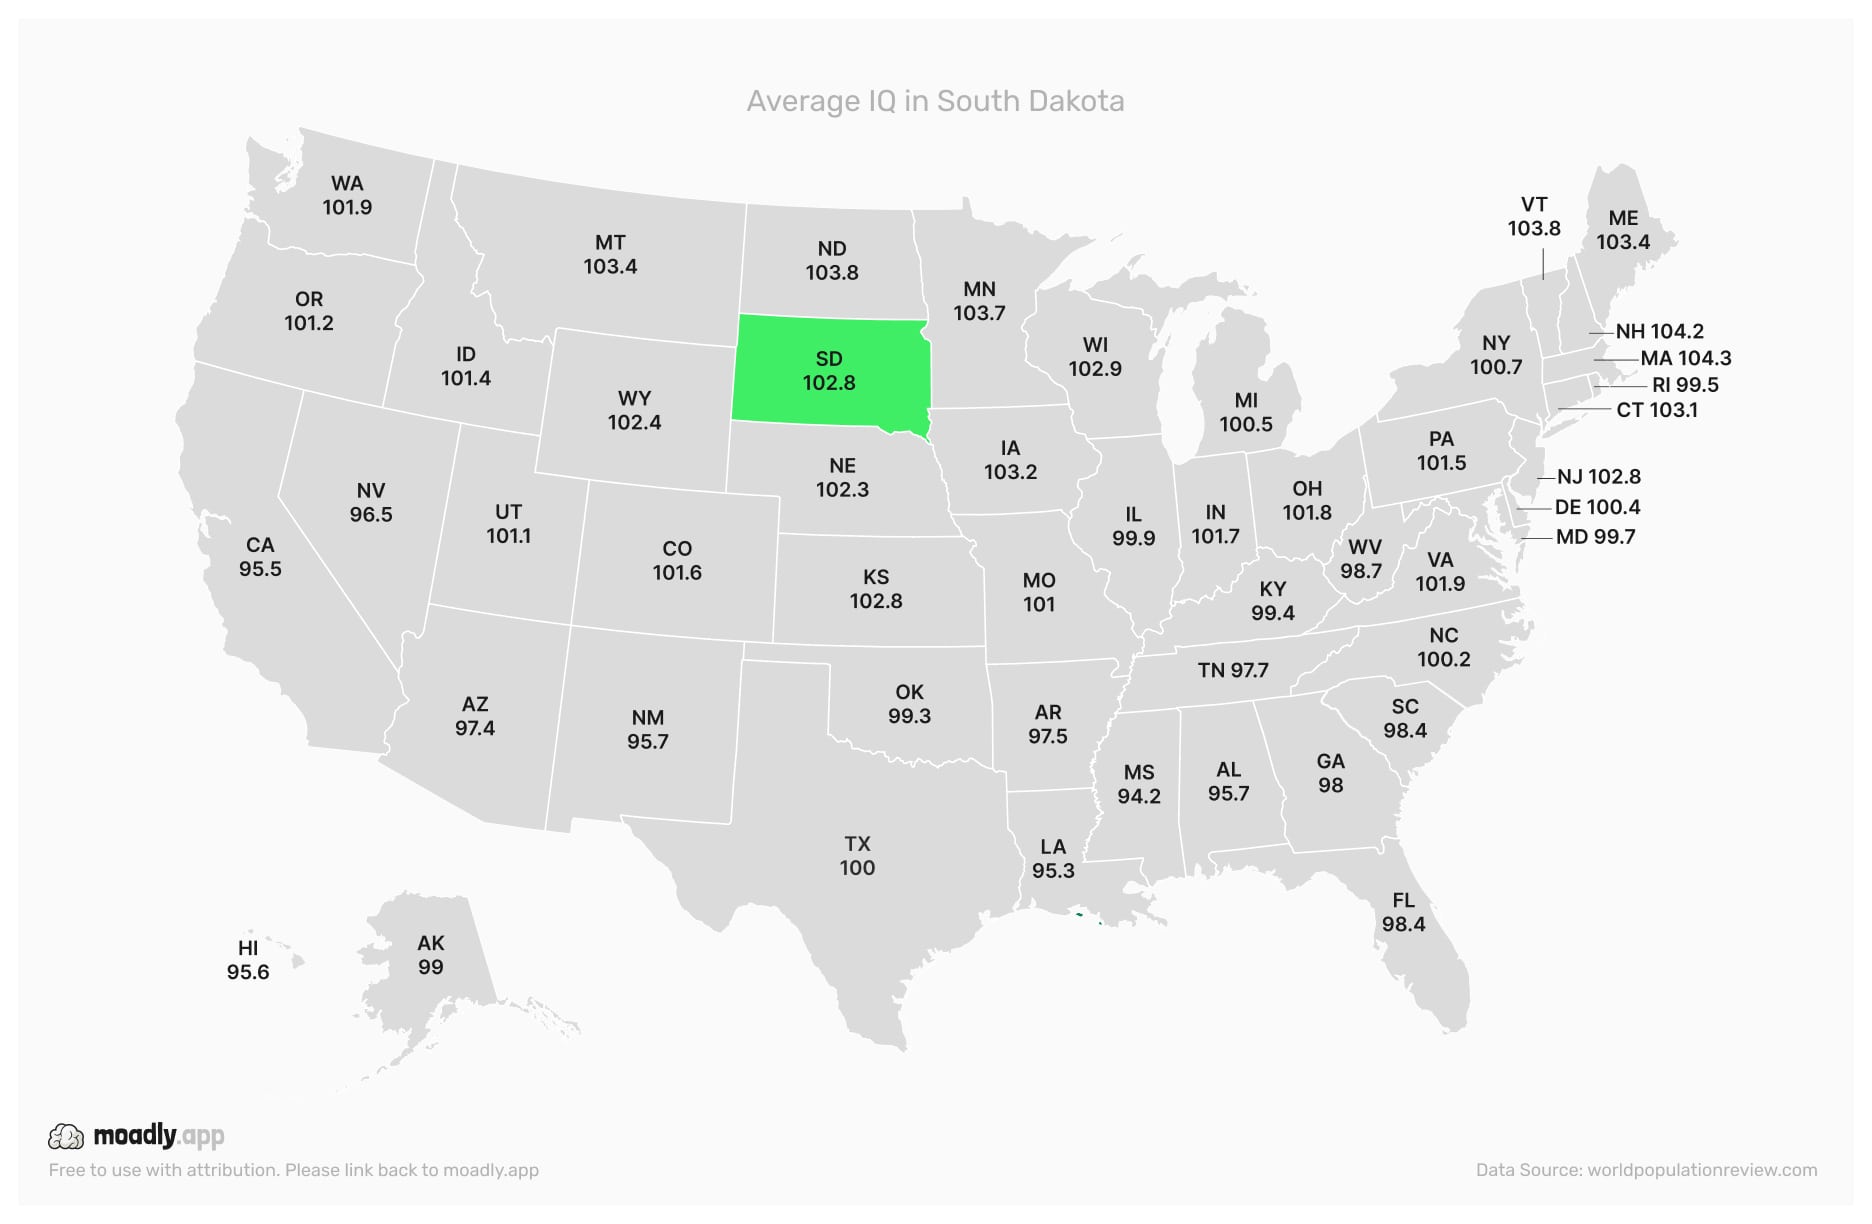
South Dakota’s rural communities and small towns influence education access, impacting the state’s IQ outcomes.
Average IQ in Tennessee
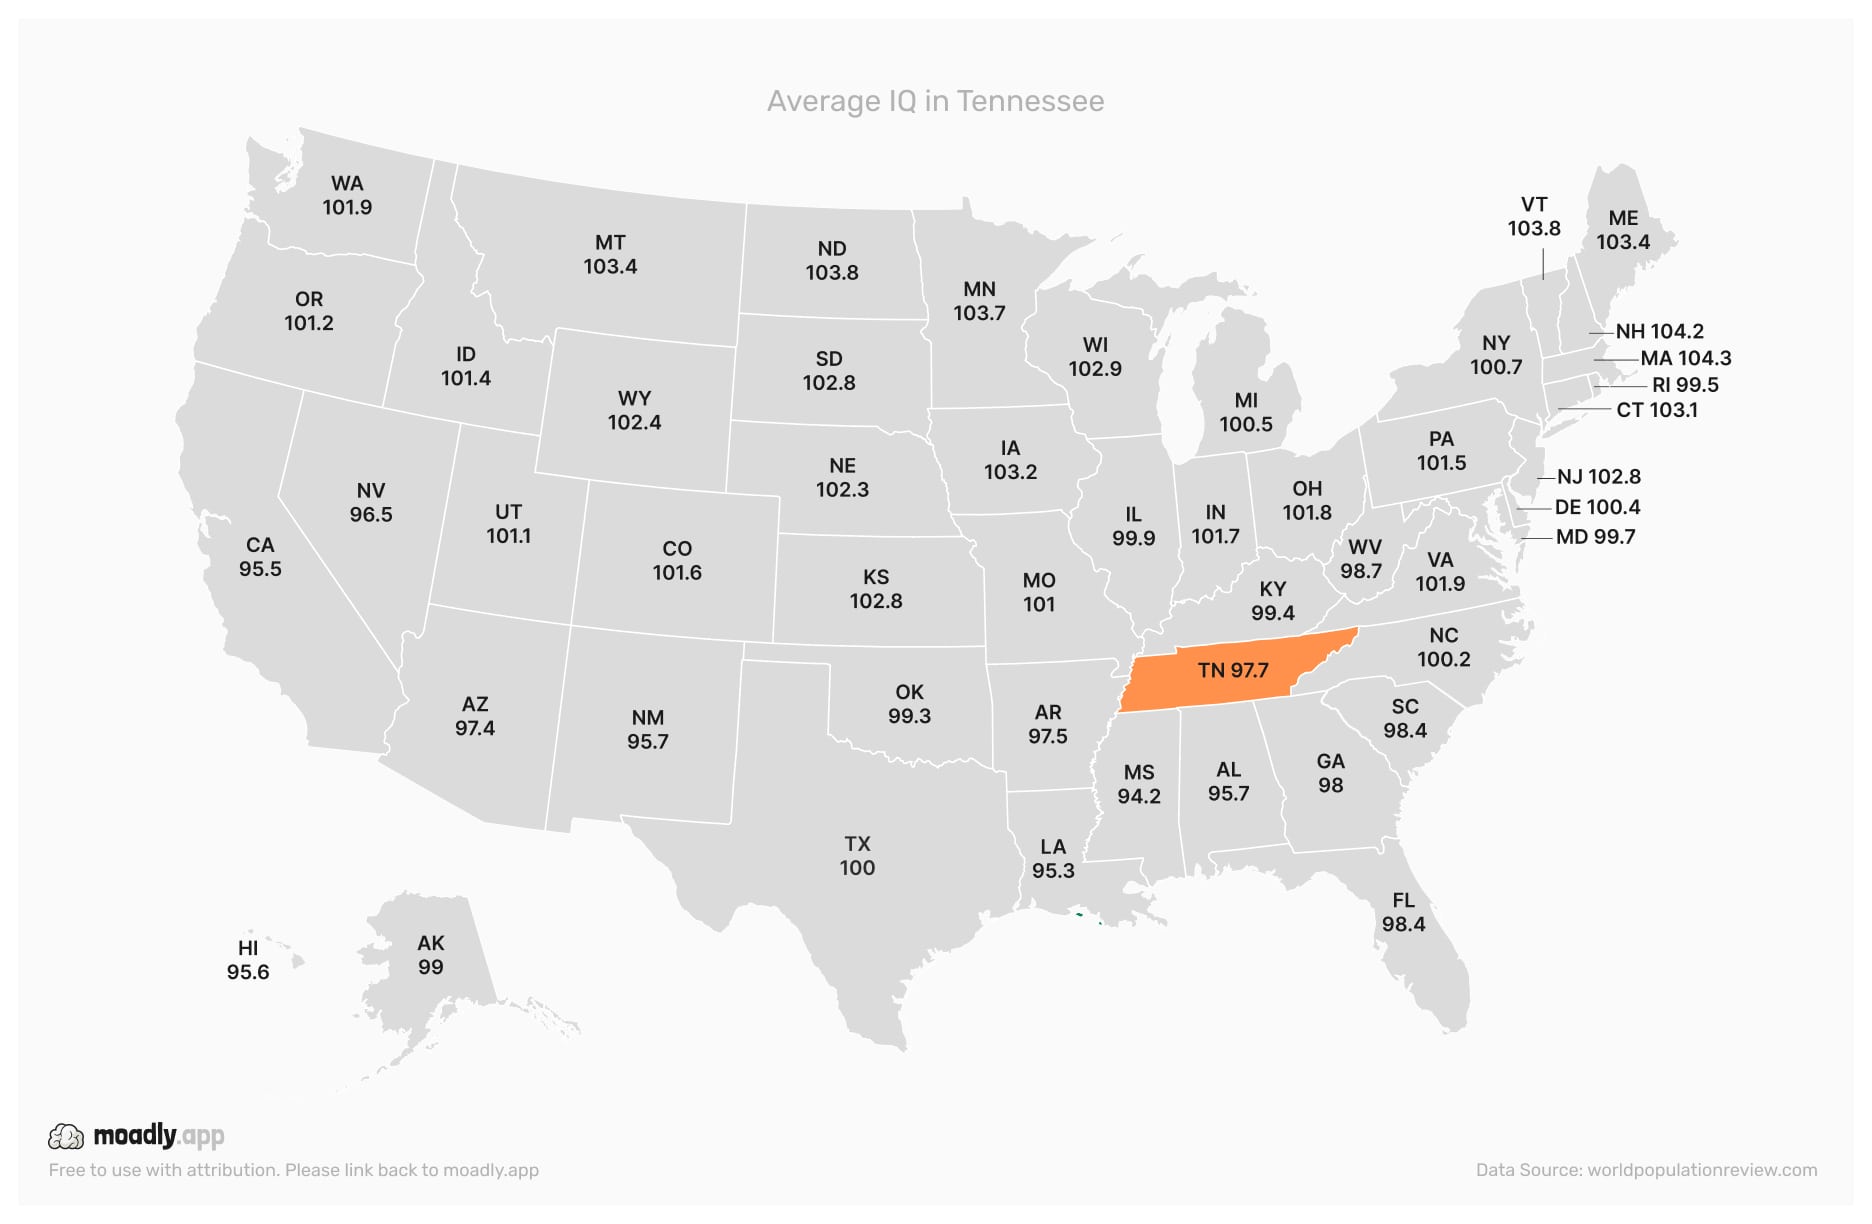
Tennessee’s combination of urban districts and rural counties produces a range of educational outcomes reflected in IQ averages.
Average IQ in Texas
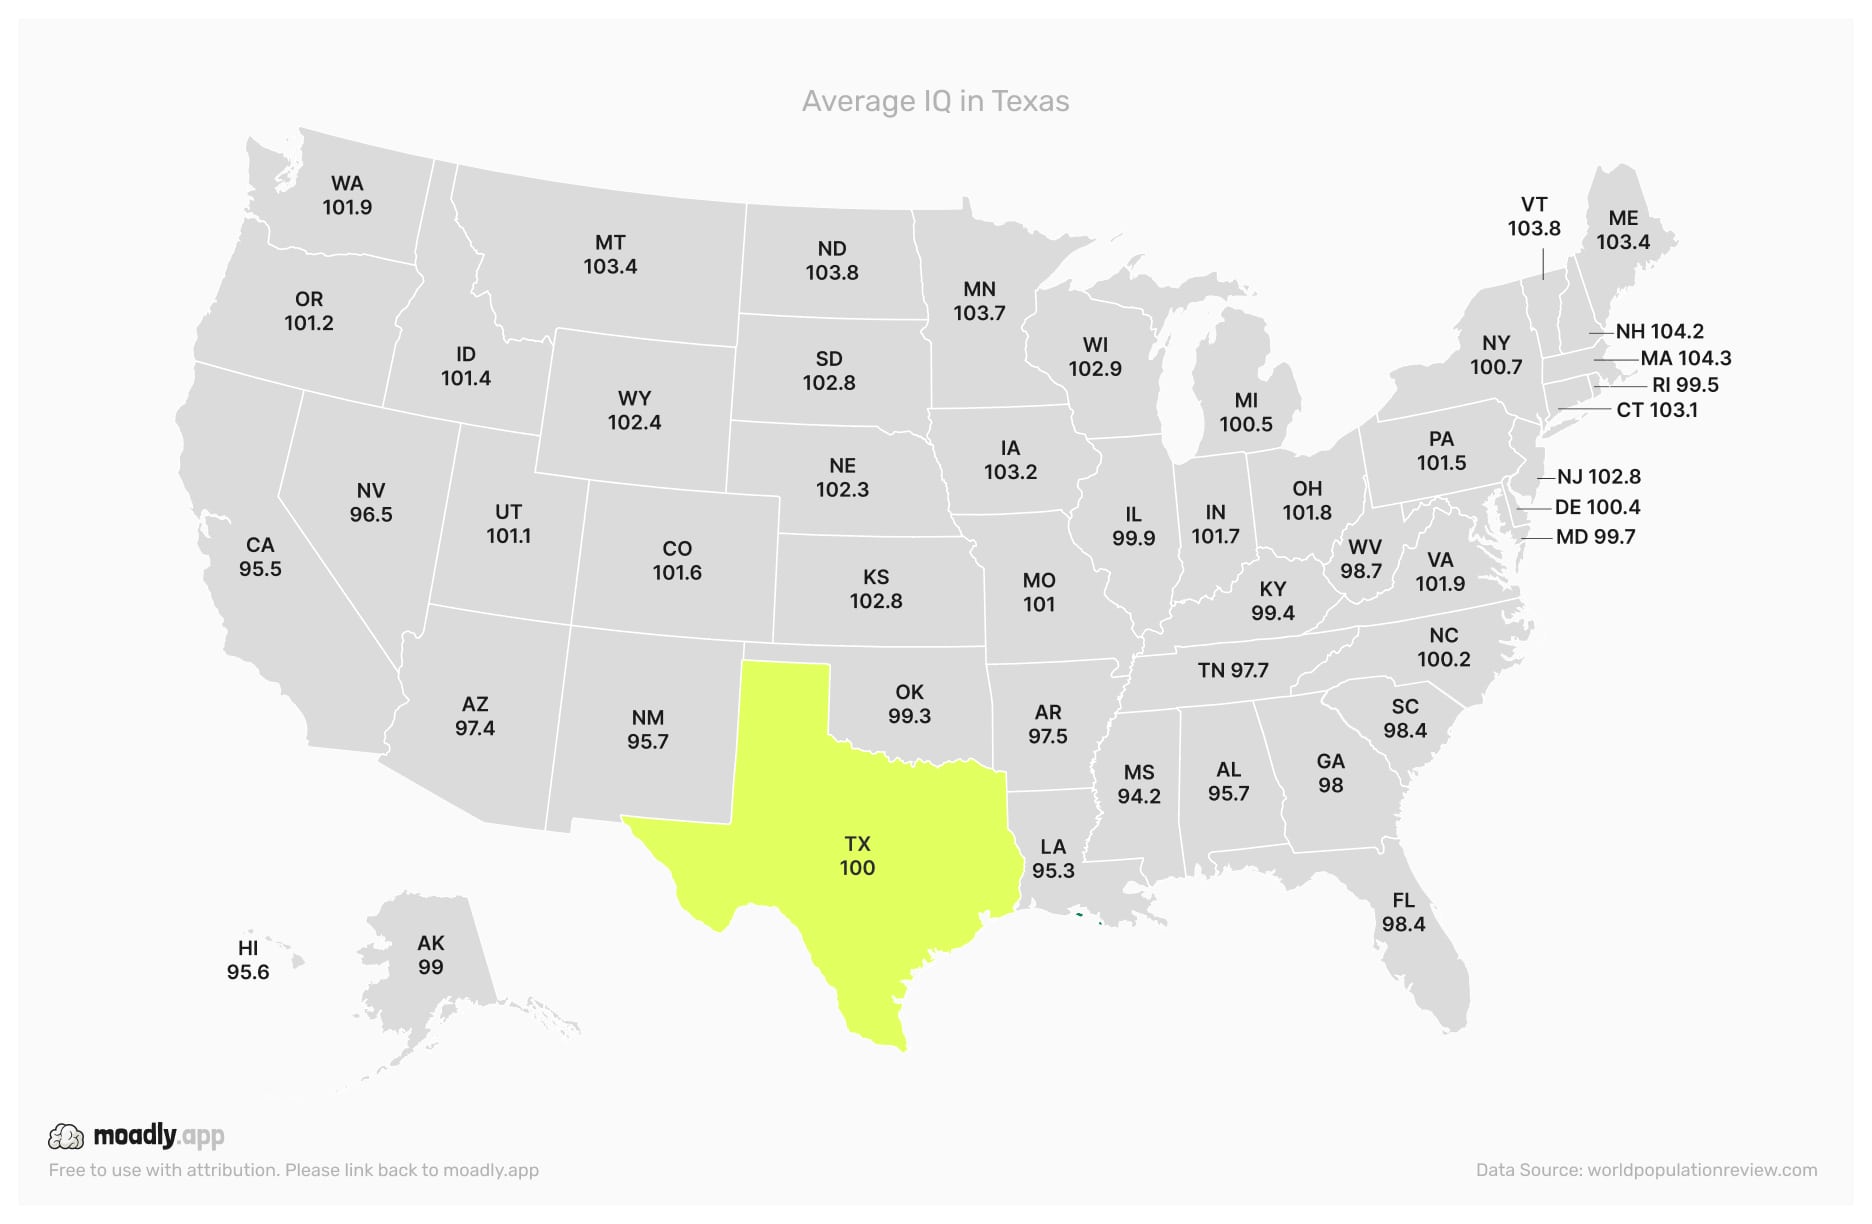
Texas’ large, diverse population and varied school systems result in a wide spectrum of educational outcomes and average IQ.
Average IQ in Utah
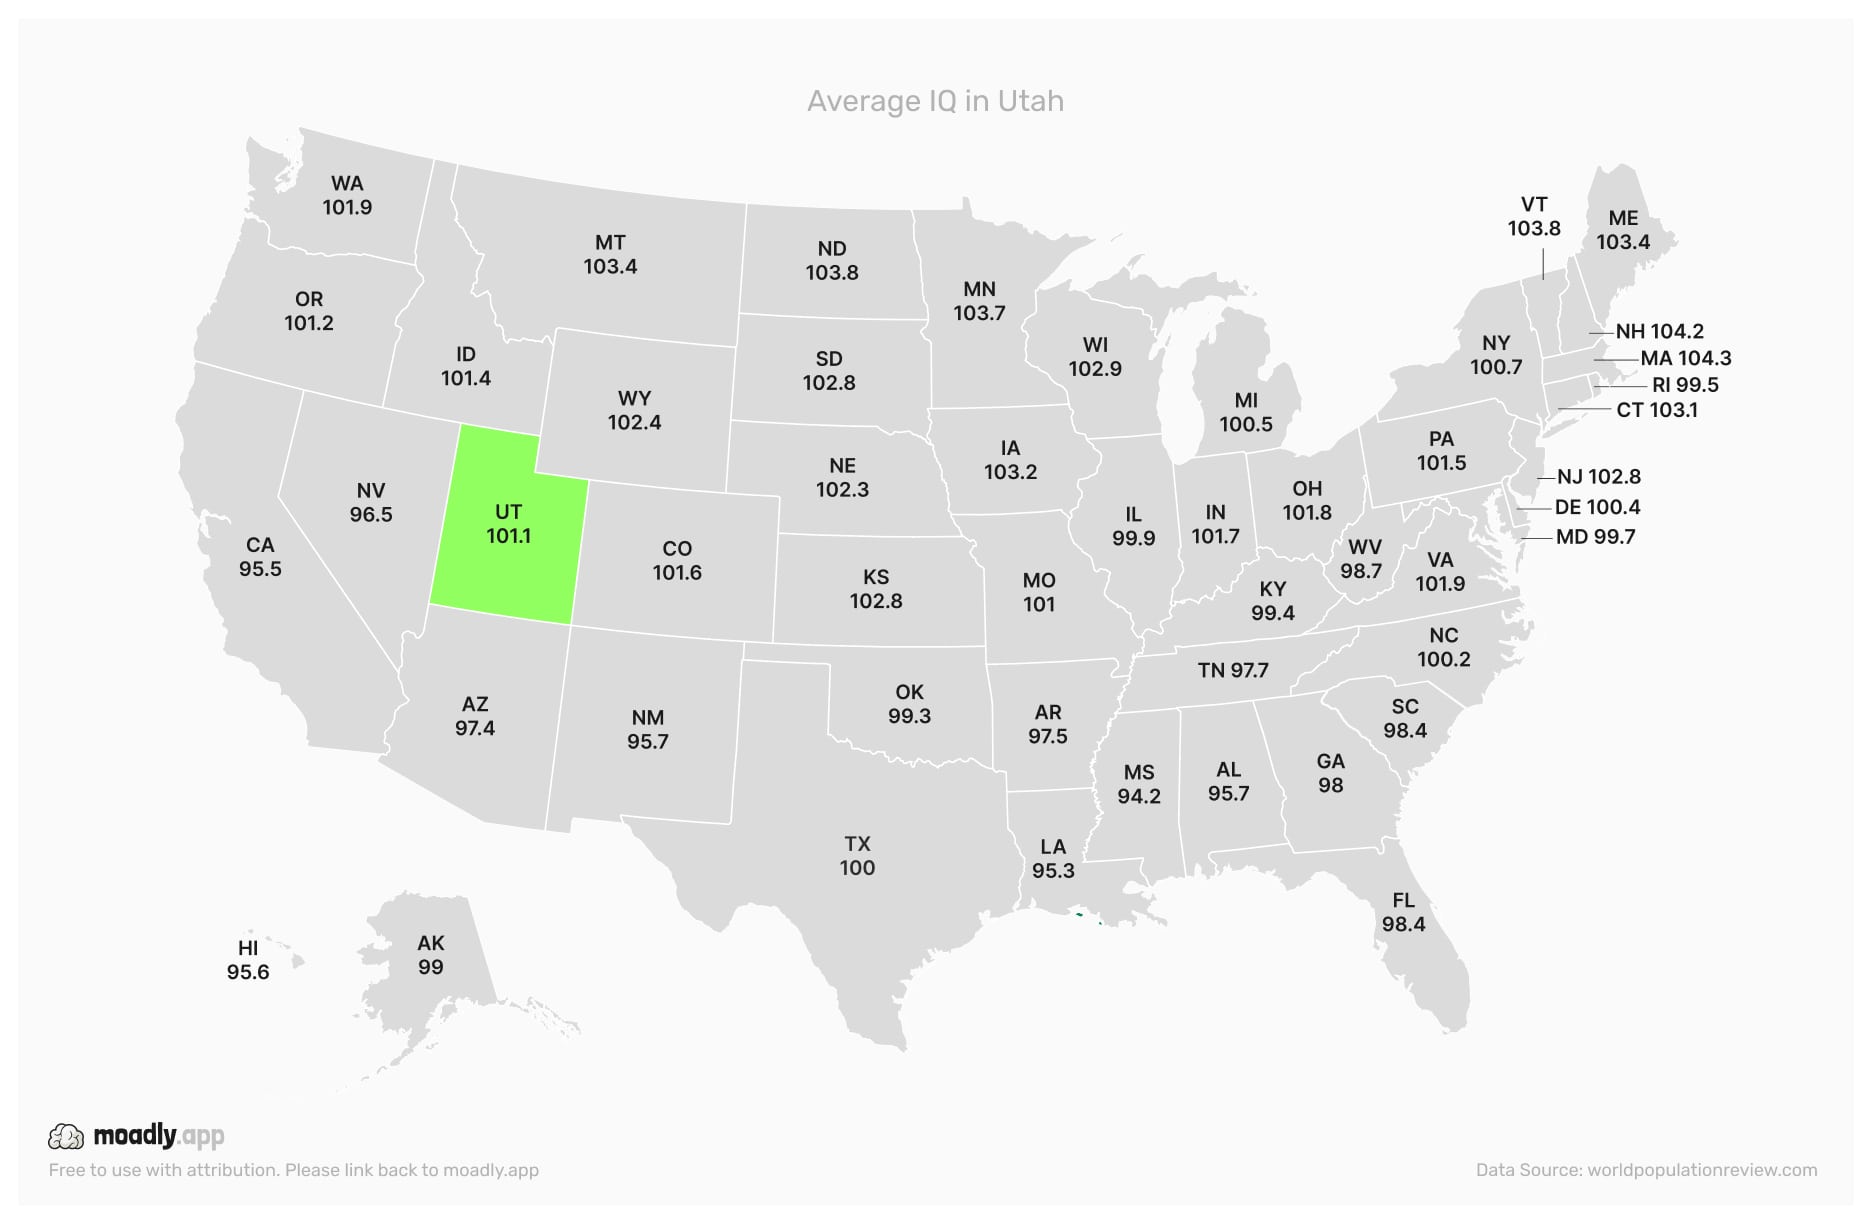
Utah’s emphasis on education and strong community support helps maintain above-average IQ outcomes statewide.
Average IQ in Vermont
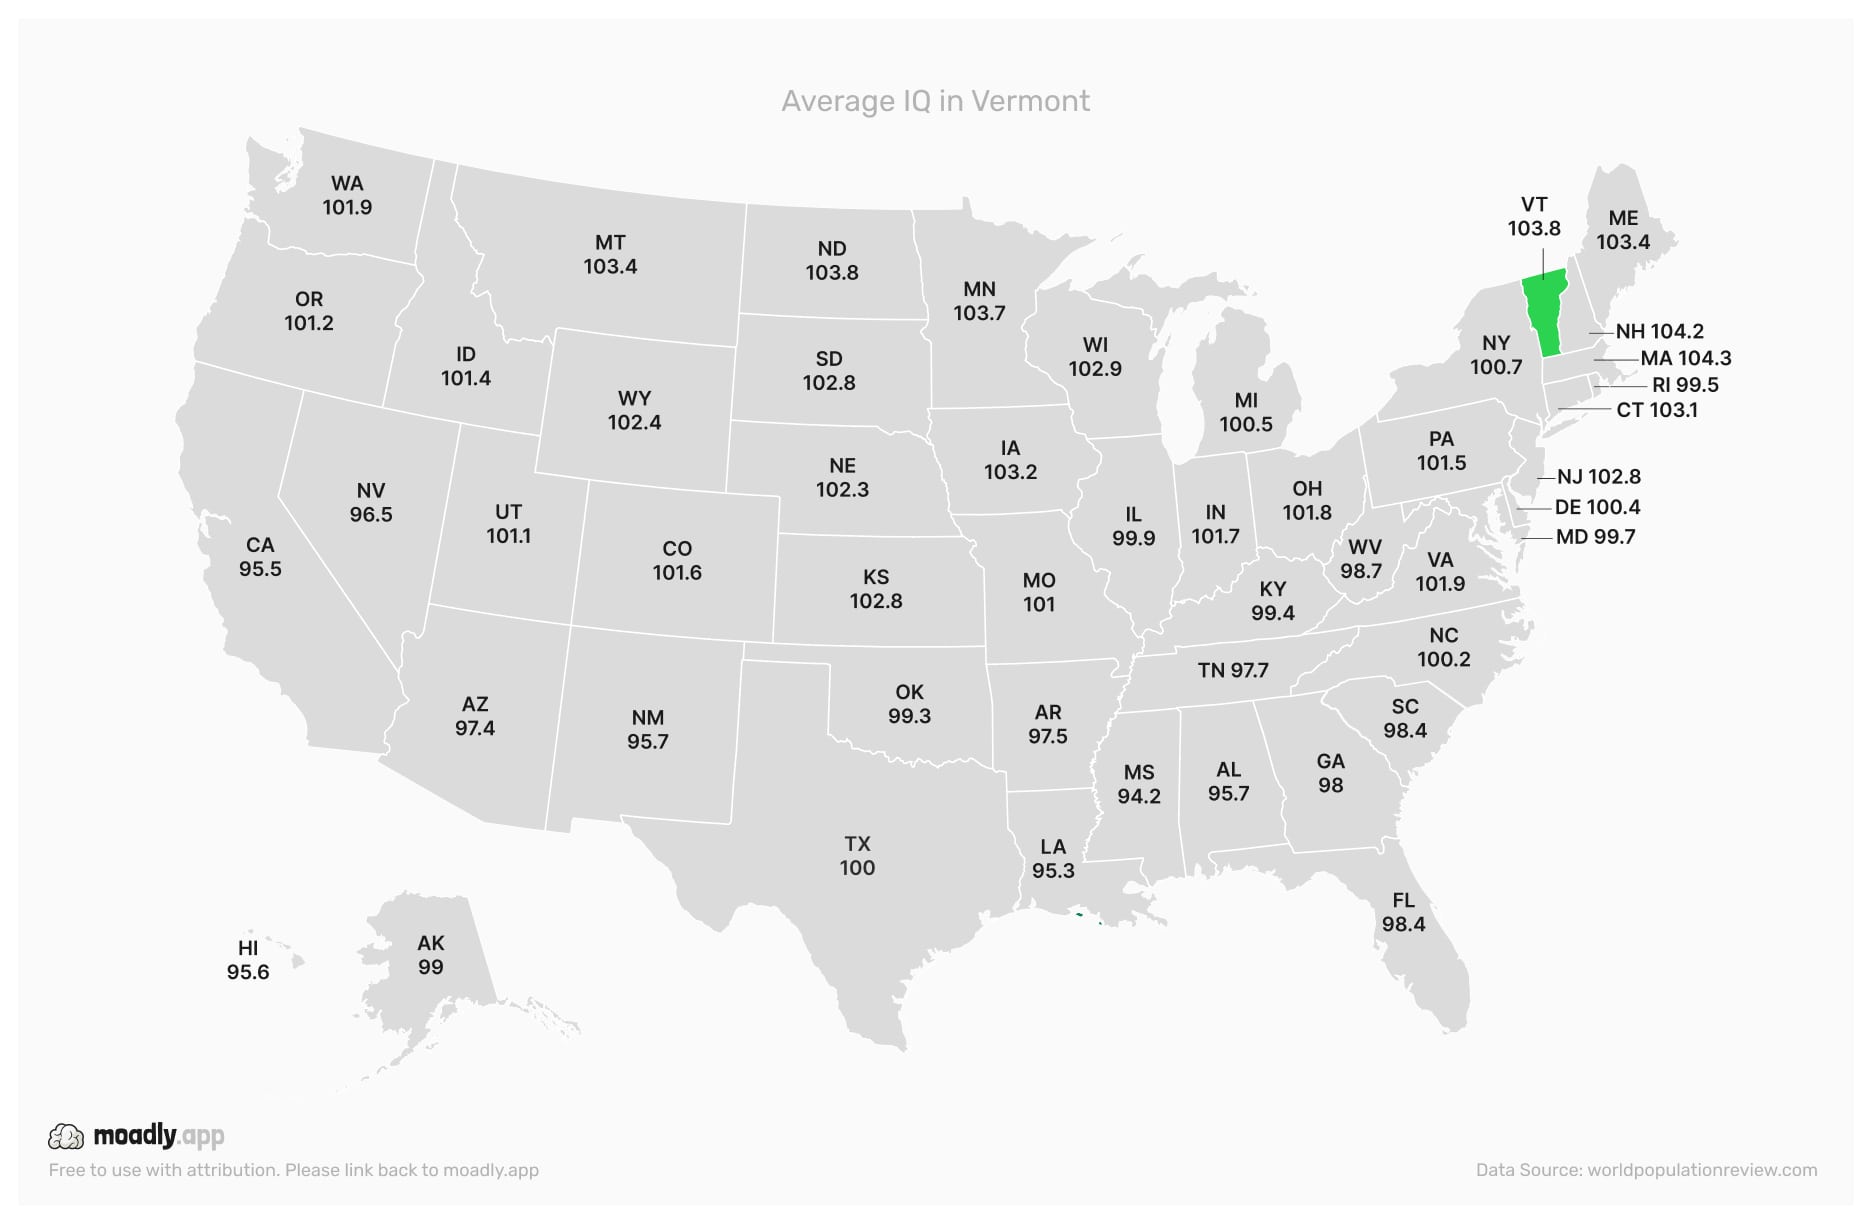
Vermont’s small population and well-resourced schools contribute to consistent and strong IQ performance across the state.
Average IQ in Virginia
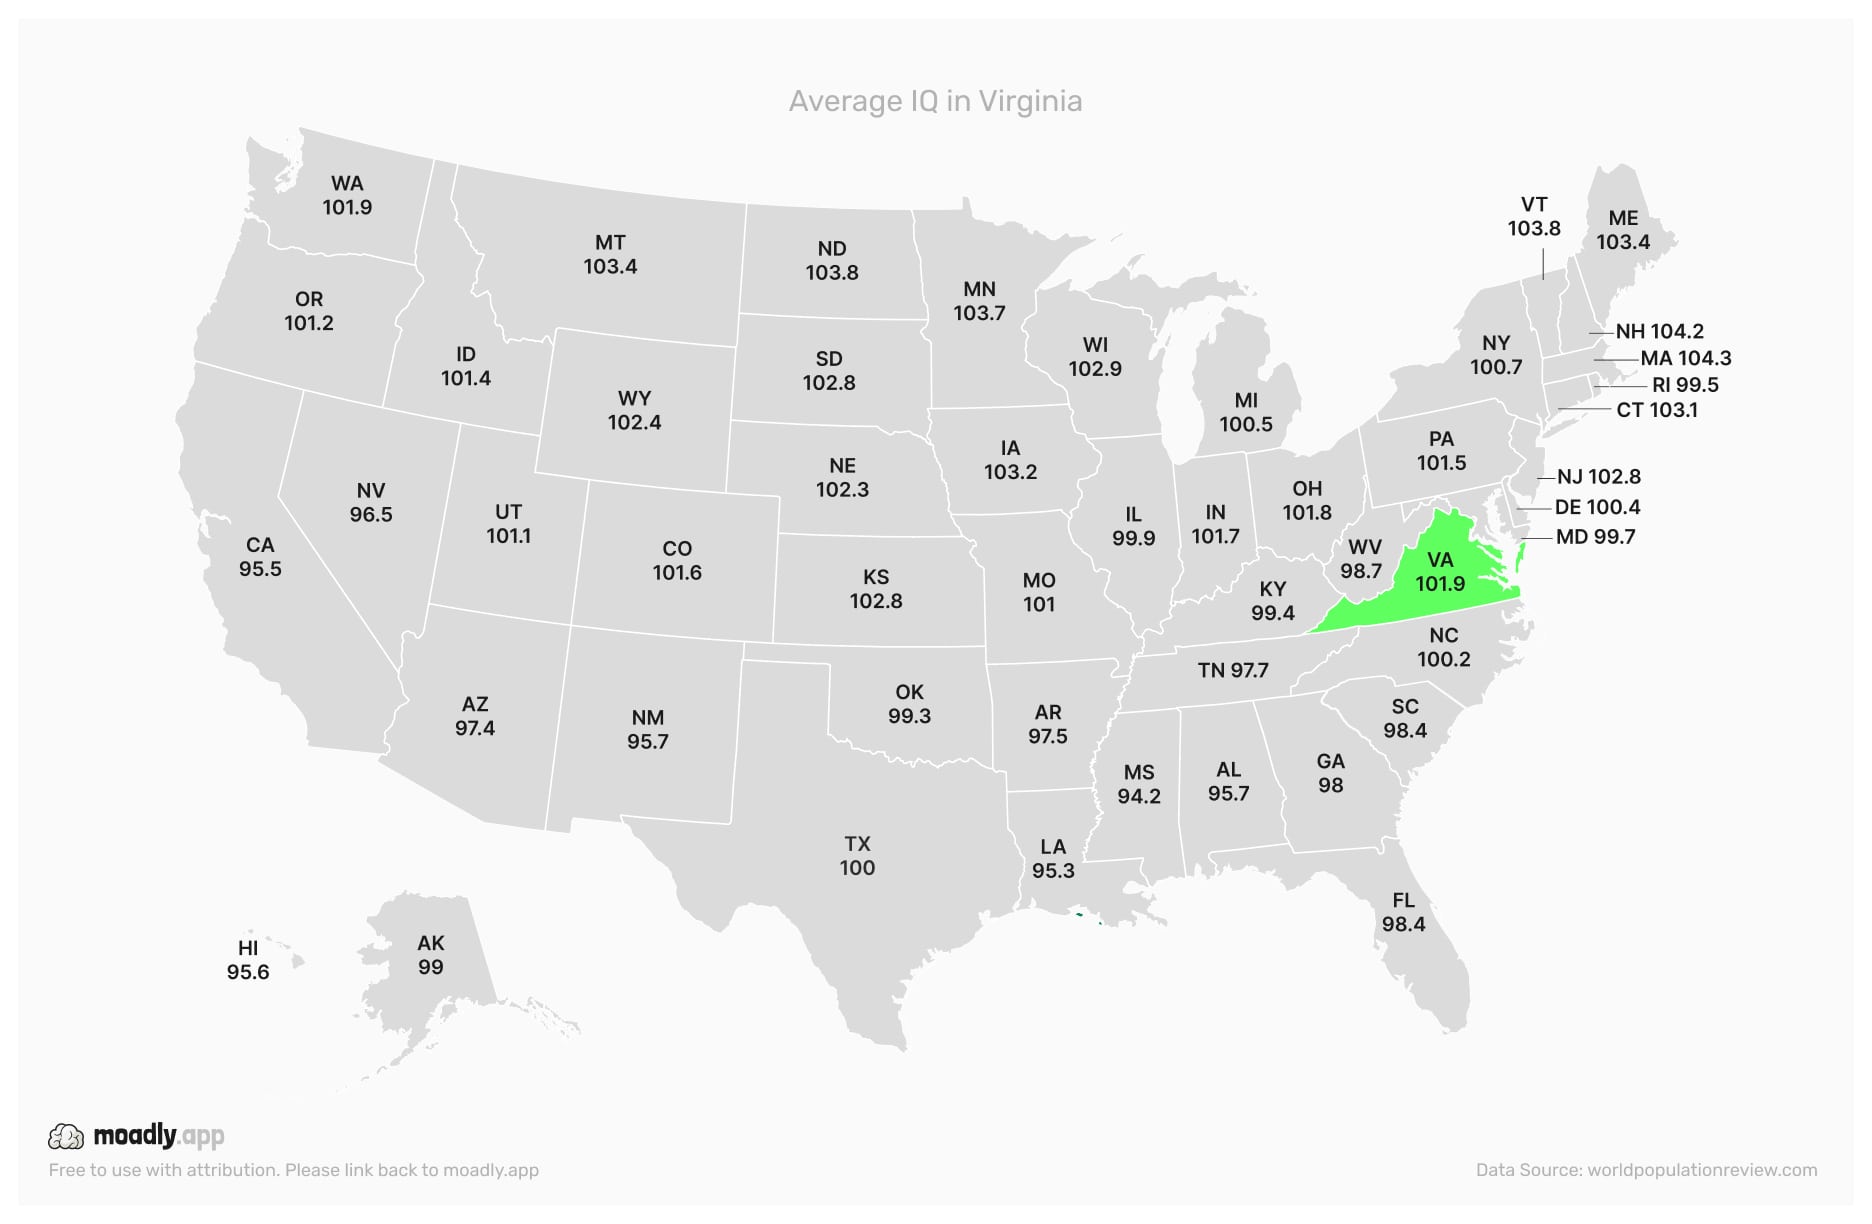
Virginia benefits from highly ranked publ ic schools and access to research universities, which support higher average IQ levels.
Average IQ in Washington
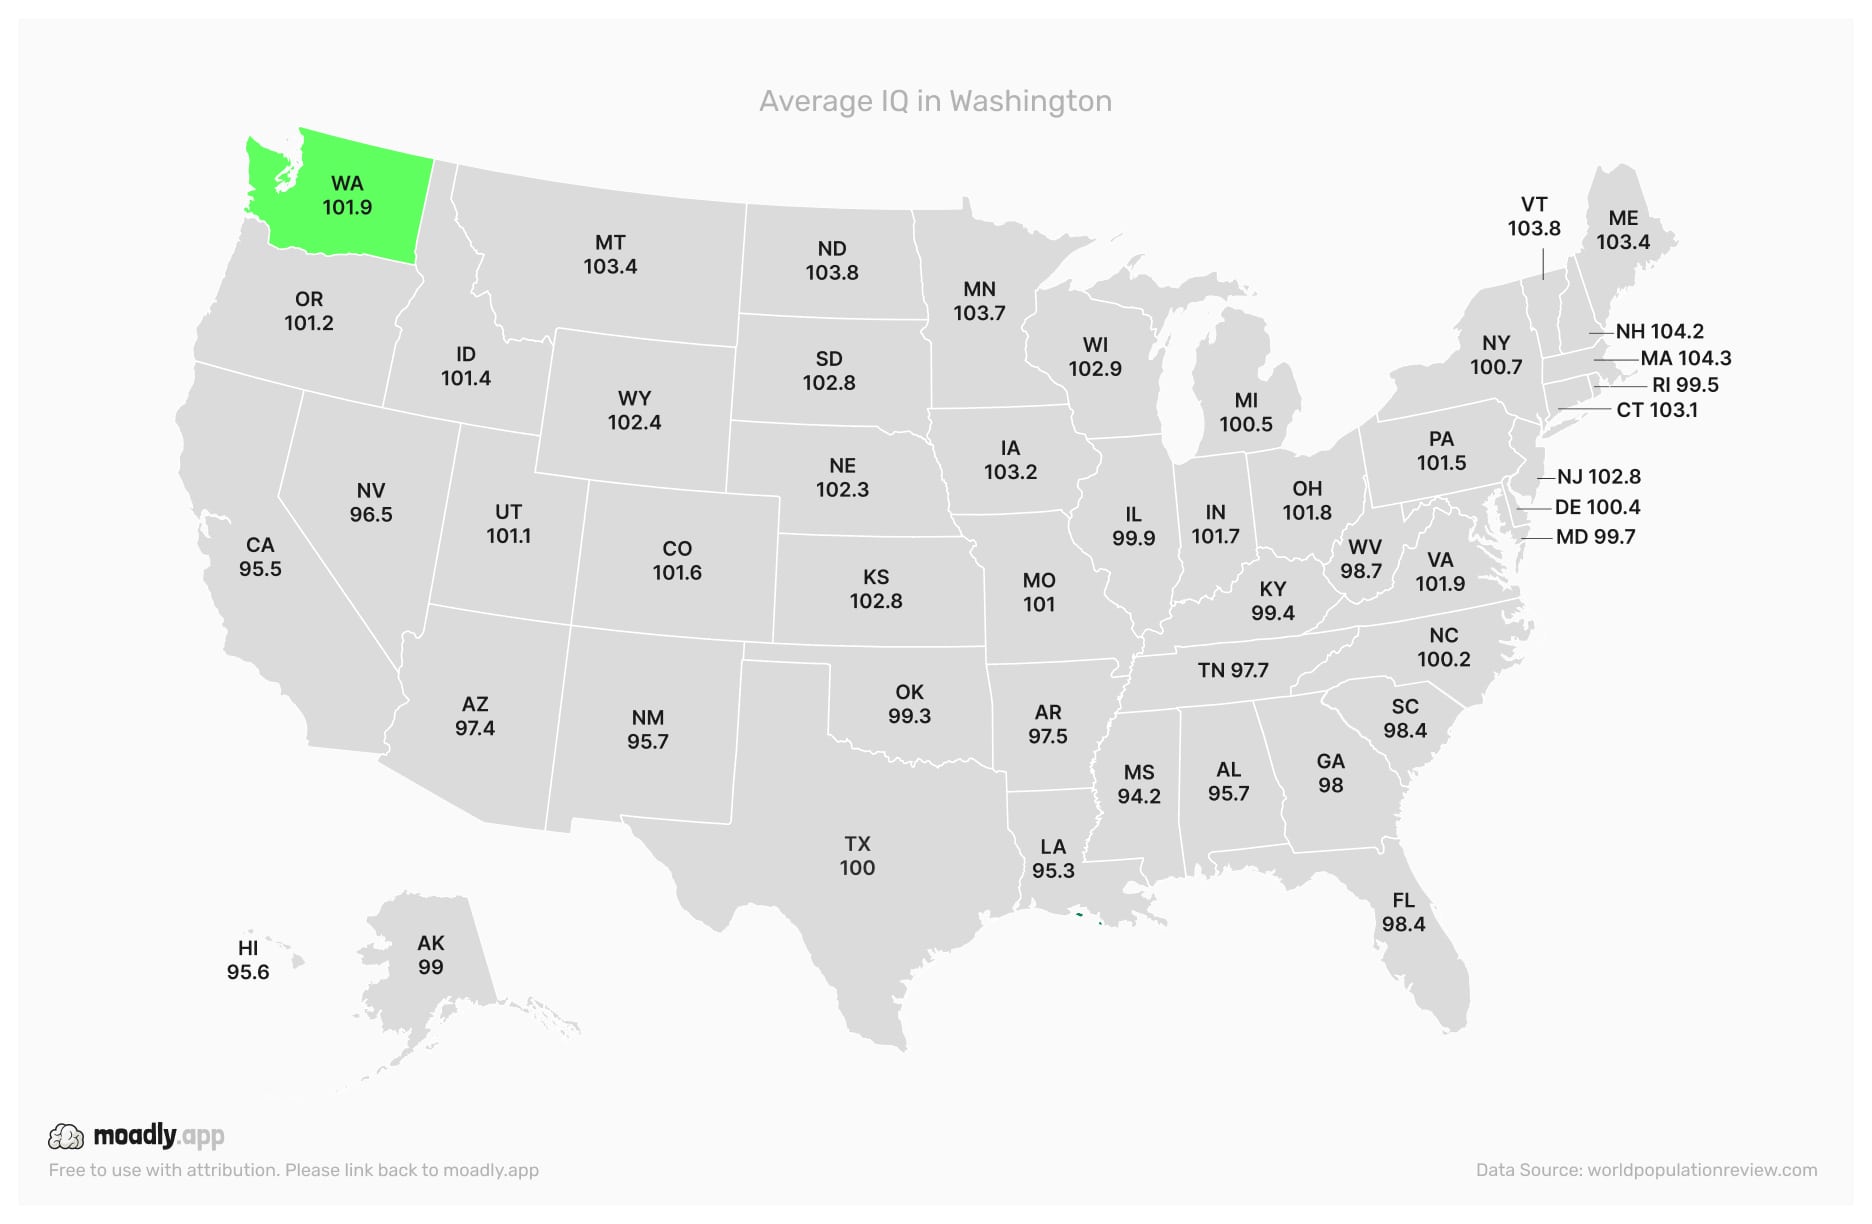
Washington’s tech-driven urban areas and rural regions create varied educational outcomes that shape the state’s average IQ.
Average IQ in West Virginia
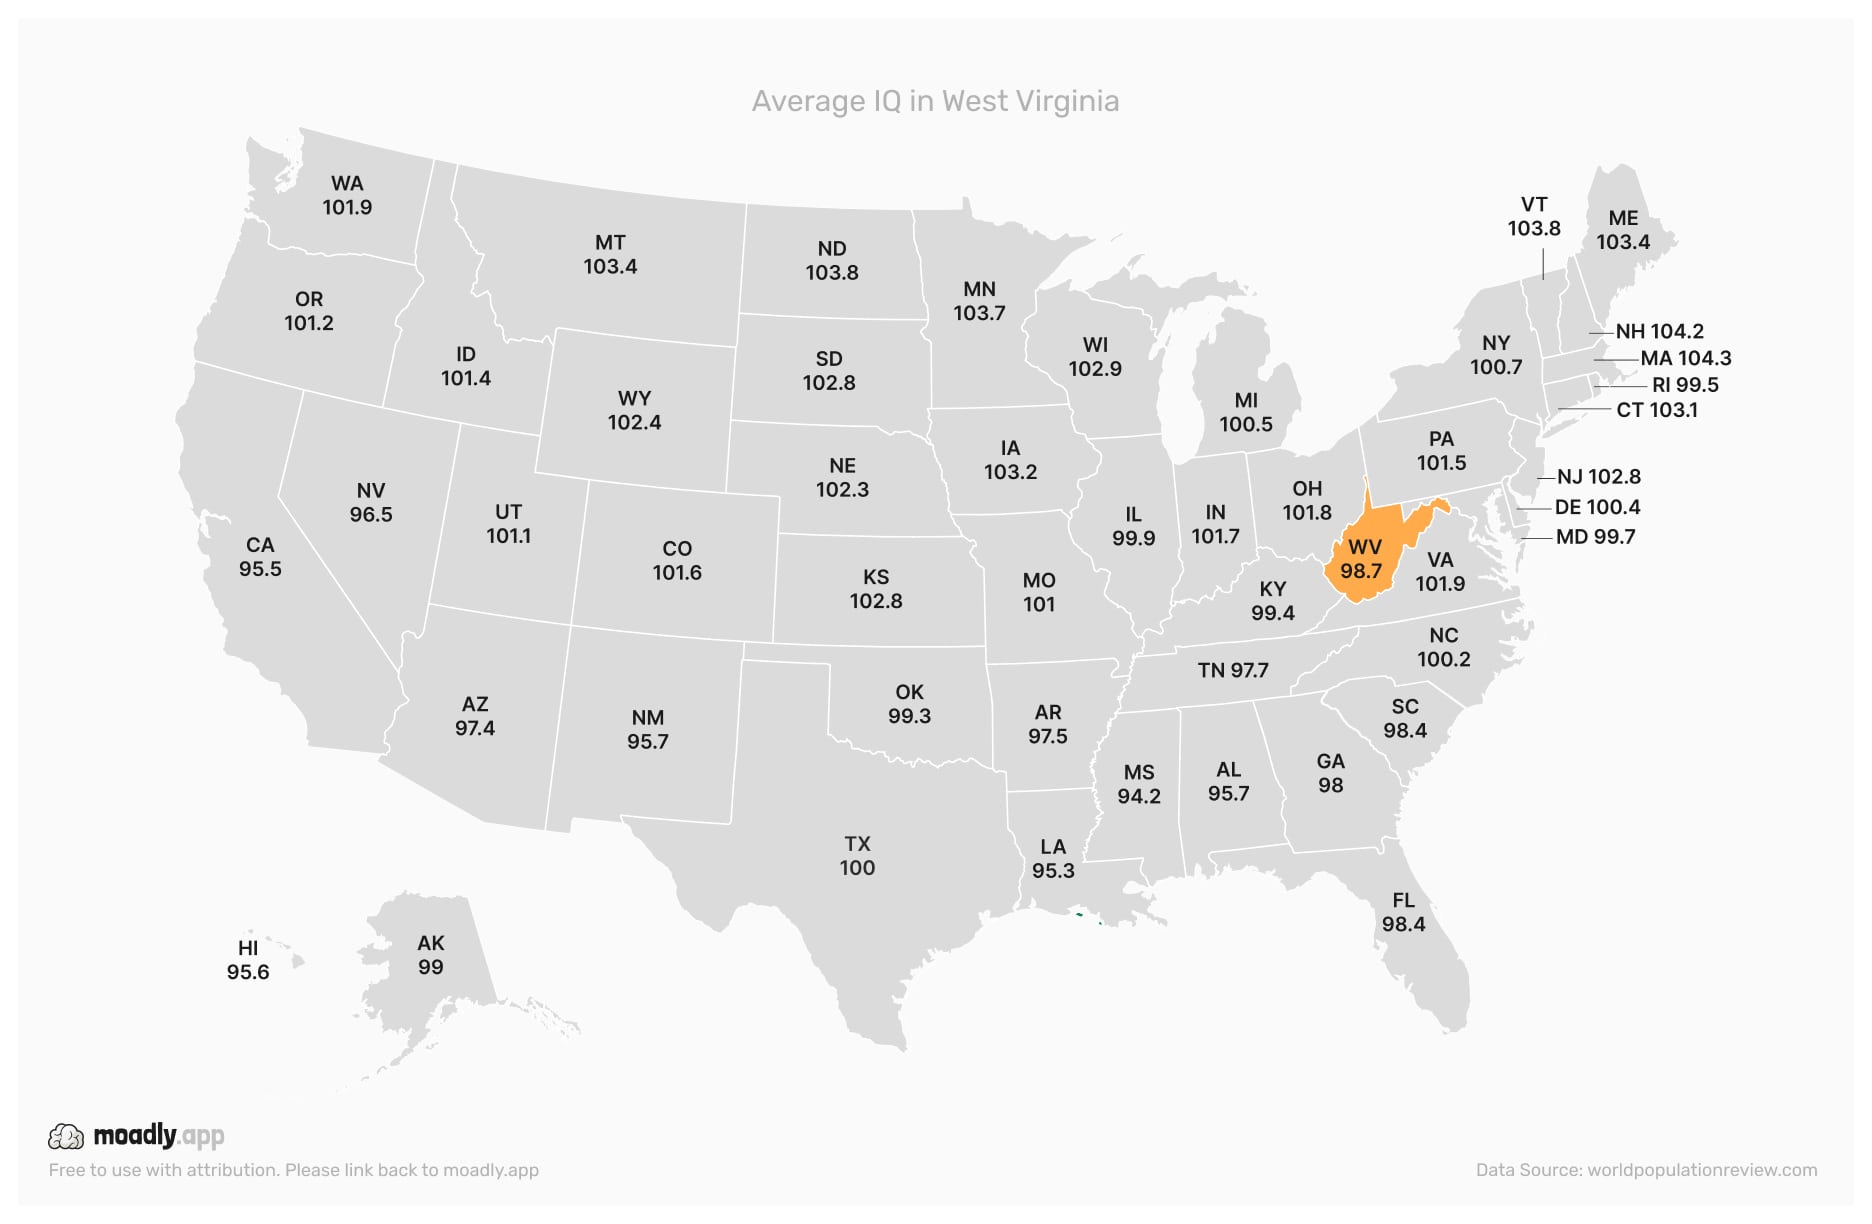
West Virginia faces rural education funding challenges, which affect access to resources and influence IQ averages.
Average IQ in Wisconsin

Wisconsin’s balance of urban and rural school districts helps maintain steady IQ outcomes across the state.
Average IQ in Wyoming
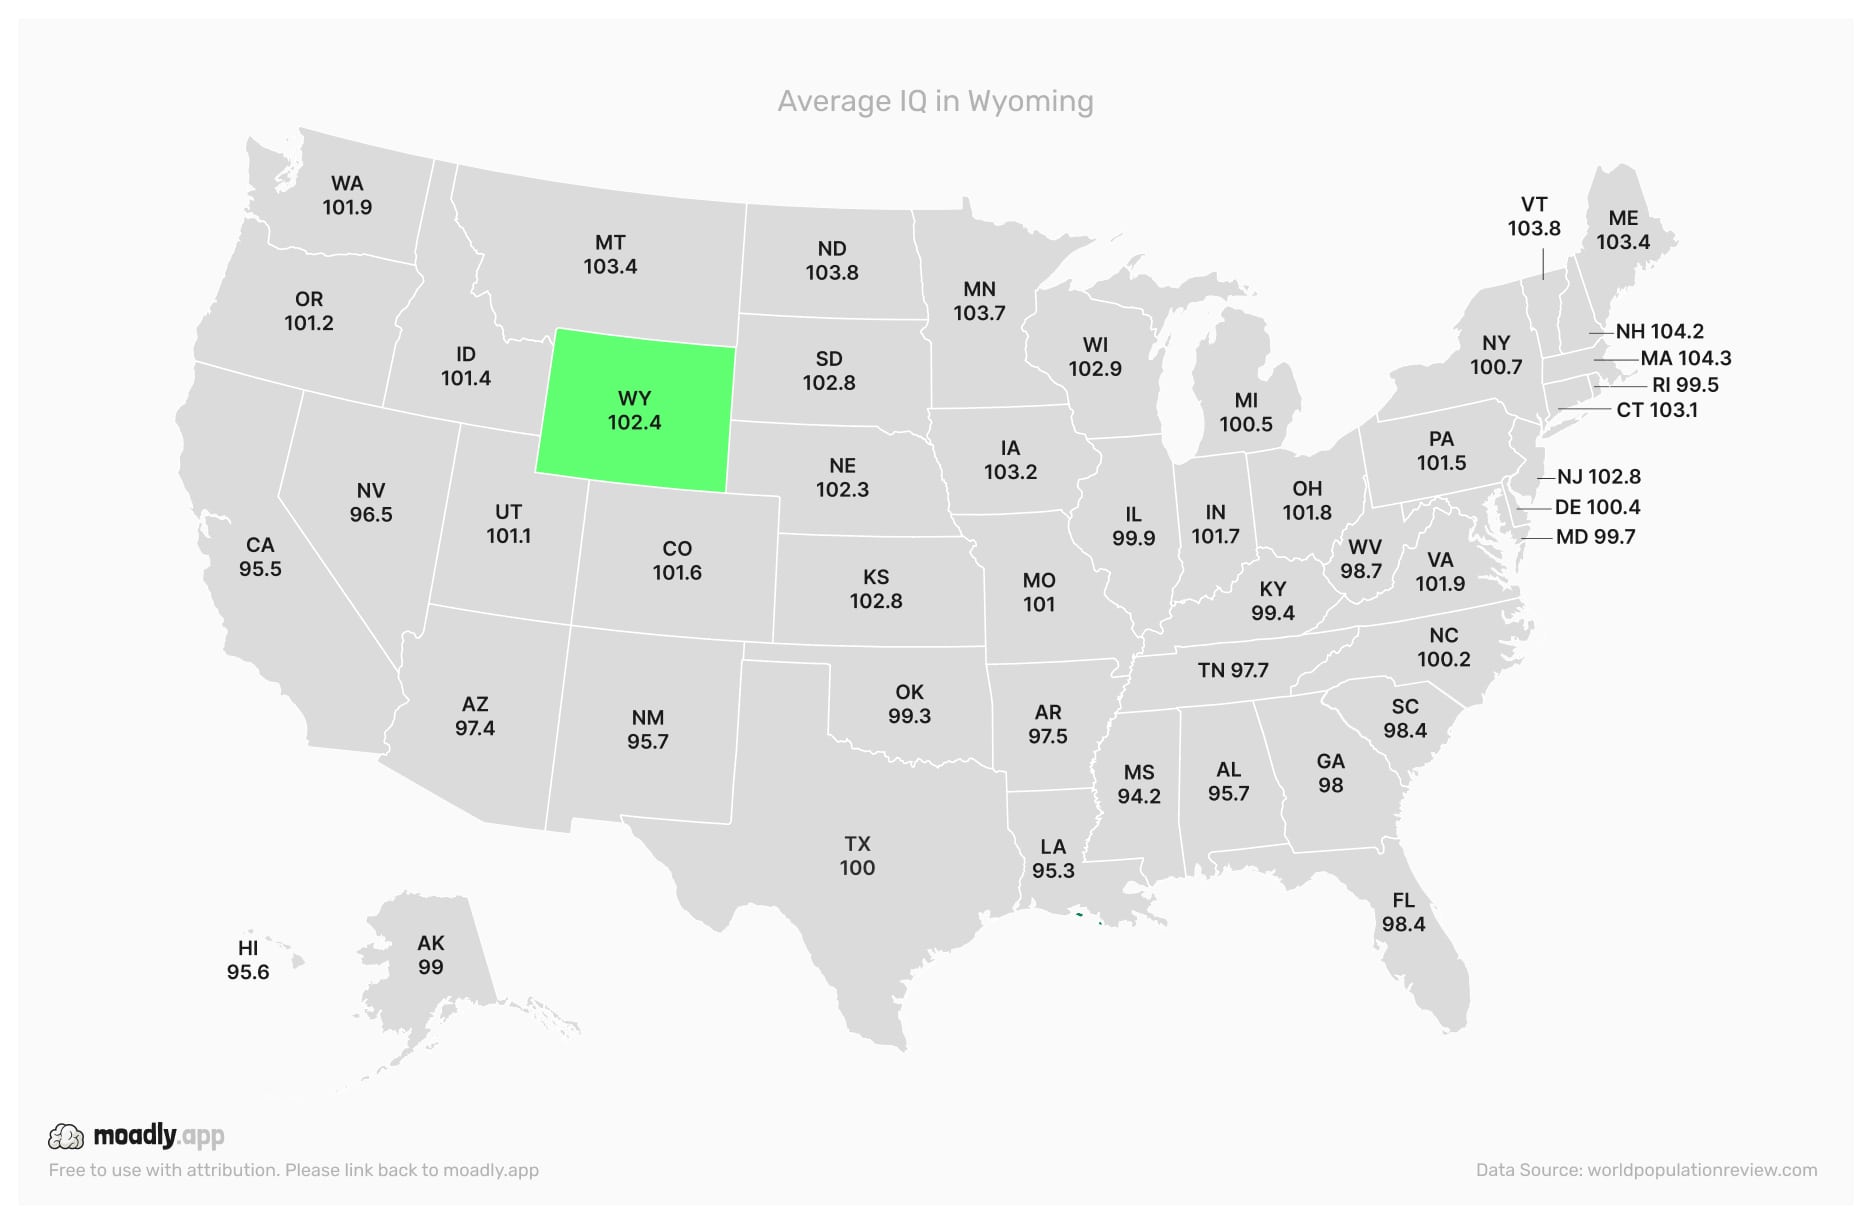
Wyoming’s low population density and remote communities present education challenges, influencing statewide average IQ.
Conclusion: What the Numbers Really Tell Us
Looking at the average IQ across U.S. states reveals more than just rankings-it uncovers clear regional patterns and insights into how education, economy, and society interact. The Northeast and Midwest consistently come out on top, thanks to a combination of strong public schools, early childhood programs, and stable socioeconomic conditions. These states show how consistent investment in learning and opportunity can shape smarter populations.
On the other hand, many Southern and some Western states fall below the national average. This isn’t just a number-it reflects historical inequalities, uneven access to quality education, and socioeconomic challenges that continue to influence cognitive outcomes today.
Ultimately, these patterns highlight something crucial: education, policy, and resource allocation matter. States that invest in children, teachers, and community support see measurable differences in average IQ, which in turn impacts long-term economic growth, innovation , and social well-being. Understanding these trends is the first step toward making informed decisions that can benefit future generations nationwide.